
7 Areas Where FX/CFD Brokerages May Be Losing Profit
By Furqan Fakar | Technical Solutions Manager, Your Bourse
A practical guide to investigating P&L, execution, liquidity costs, markups and client-flow quality, and deciding which controls deserve review.
 |
About the author Furqan Fakar is Technical Solutions Manager at Your Bourse and has a background in institutional trading. He works with brokerage businesses on trading infrastructure, execution workflows and risk management requirements. |
Your bridge is stable. Trades are executing. There are no obvious errors in the logs.
But is the setup producing the profit it should?
Uptime and execution stability tell you whether the infrastructure is functioning. They do not tell you whether orders are being routed profitably, liquidity providers remain competitive, markups generate the expected revenue or particular clients are exposing the book to avoidable risk.
Profit is often lost gradually: an LP becomes less competitive, an old markup no longer reflects current trading conditions, or a previously profitable segment of B-book flow changes behaviour. None of these necessarily creates an operational alert.
At $100 billion in monthly volume, an improvement of $0.10 net contribution per million traded across all flow would equal $10,000 per month ($120,000 annually). This is hypothetical, not a claim of typical savings.
To find potential profit leakage, a broker needs to connect three things:
- The financial result: Where was money made or lost?
- The underlying cause: Which trades, prices, counterparties or clients produced it?
- The corrective control: What should be reviewed or changed?
This guide shows how Your Bourse supports that process.
Important distinction: Not everything in a profitability review is a metric. P&L, markup revenue and markouts are measurements. Aggregation, routing, volume bands and Last Look are controls that may be adjusted after the measurements reveal a problem.
What should you investigate first?
The right starting point depends on the pattern you see.
| Signal | First investigation | Possible control to review |
|---|---|---|
| A-book loss concentrated in one symbol | Trade-level execution and LP comparison | LP mix, priority or routing |
| Markup revenue below expectation | Applied pricing rules and traded volume | Markups or volume bands |
| One IB has high volume but weak contribution | P&L components, rebates and client mix | Commercial terms or routing policy |
| Repeated adverse client markouts | Timing, strategy and execution data | Monitoring, routing or execution controls |
| Distributed spreads differ unexpectedly | LP inputs and pricing configuration | Aggregation or markup configuration |
These are starting points, not automatic diagnoses. Validate changes with sufficient data.
1. A-book and B-book P&L: Where is the brokerage making or losing money?
What to monitor
A single blended P&L number can hide a weak book, symbol, group or revenue component. Review A-book and B-book performance separately, then break each down by:
- Symbol and account group
- Markup and commission revenue
- IB rebates
- Overnight swaps
- Relevant time period
How to interpret it
Identify repeatable sources of profit and loss, not just whether the total was positive.
For example:
B-book performance was positive overall, but A-book flow in one symbol produced a persistent loss per million traded.
That finding does not yet explain the cause. It tells the dealing team where to investigate next.
How Your Bourse supports the review
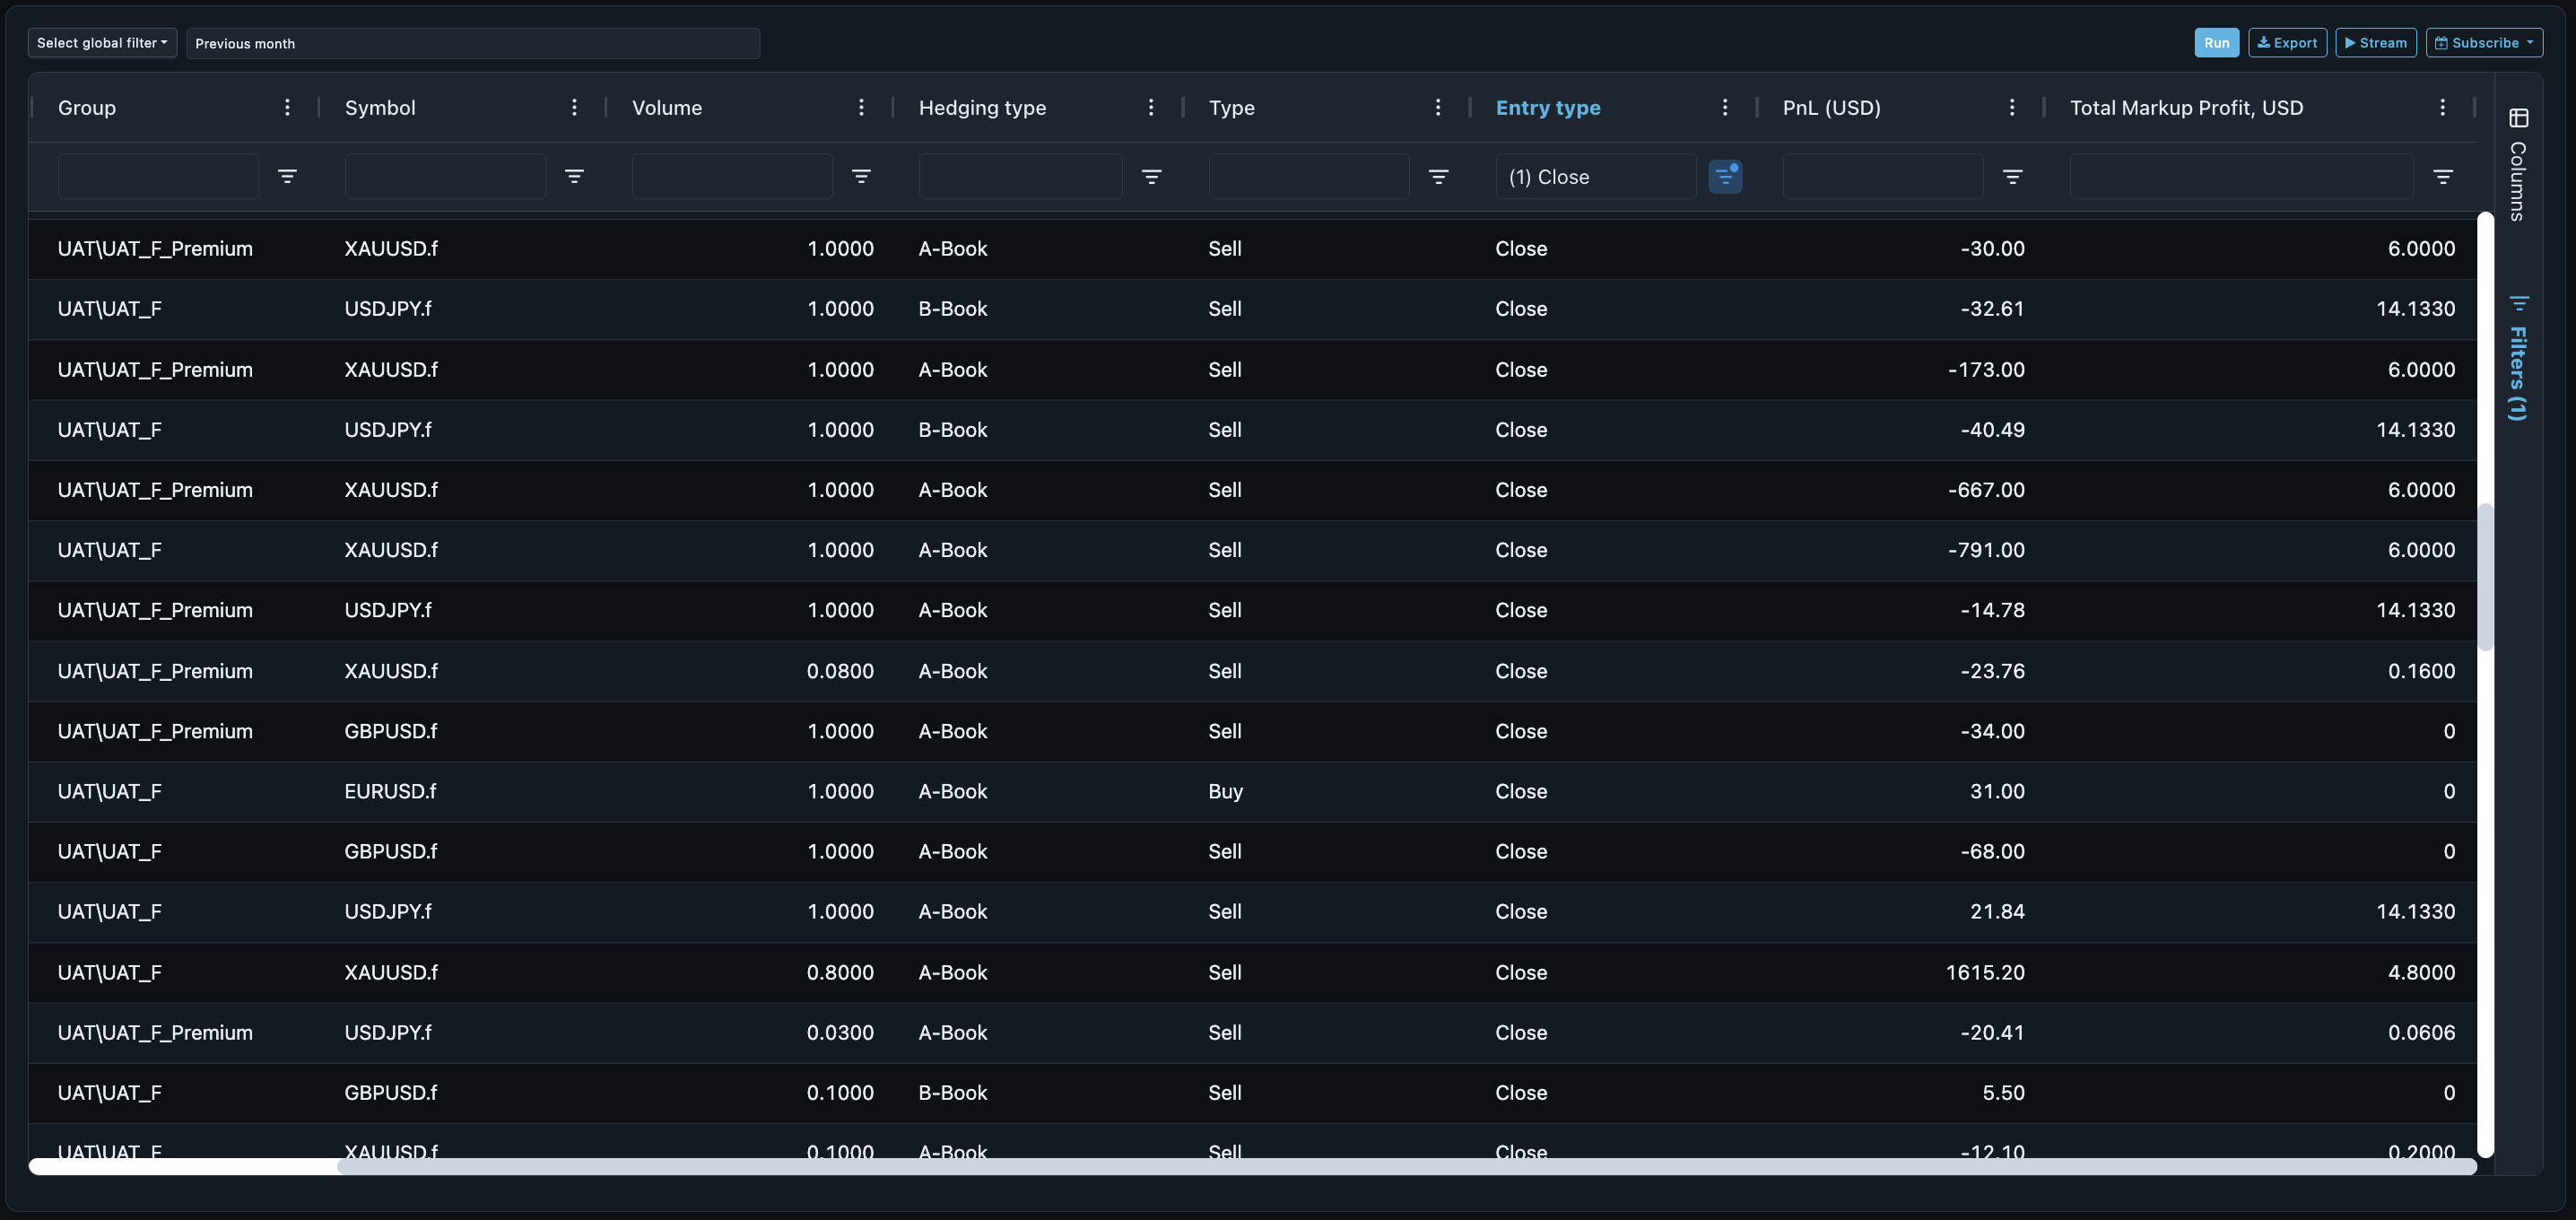
The Profit & Loss reporting suite includes:
- Monthly P&L
- P&L by Symbol
- Monthly P&L by IB
- P&L by Symbol and IB
The reports separate A-book and B-book performance and break the result down into components including markup, commission, IB rebates and swaps.
Begin with the financial result, then isolate the book, symbol or group that requires investigation.
2. Trade-level execution: What caused the result?
What to monitor
Once an unusual P&L result has been identified, examine the trades behind it. Relevant fields include:
- Requested price
- Client execution price
- Slippage
- A-book or B-book allocation
- Maker spread
- Execution details
How to interpret it
Poor results may stem from pricing, hedging, routing, liquidity or trade timing. If one A-book symbol deteriorates, compare the underlying client and maker-side execution before assigning a cause.
How Your Bourse supports the review
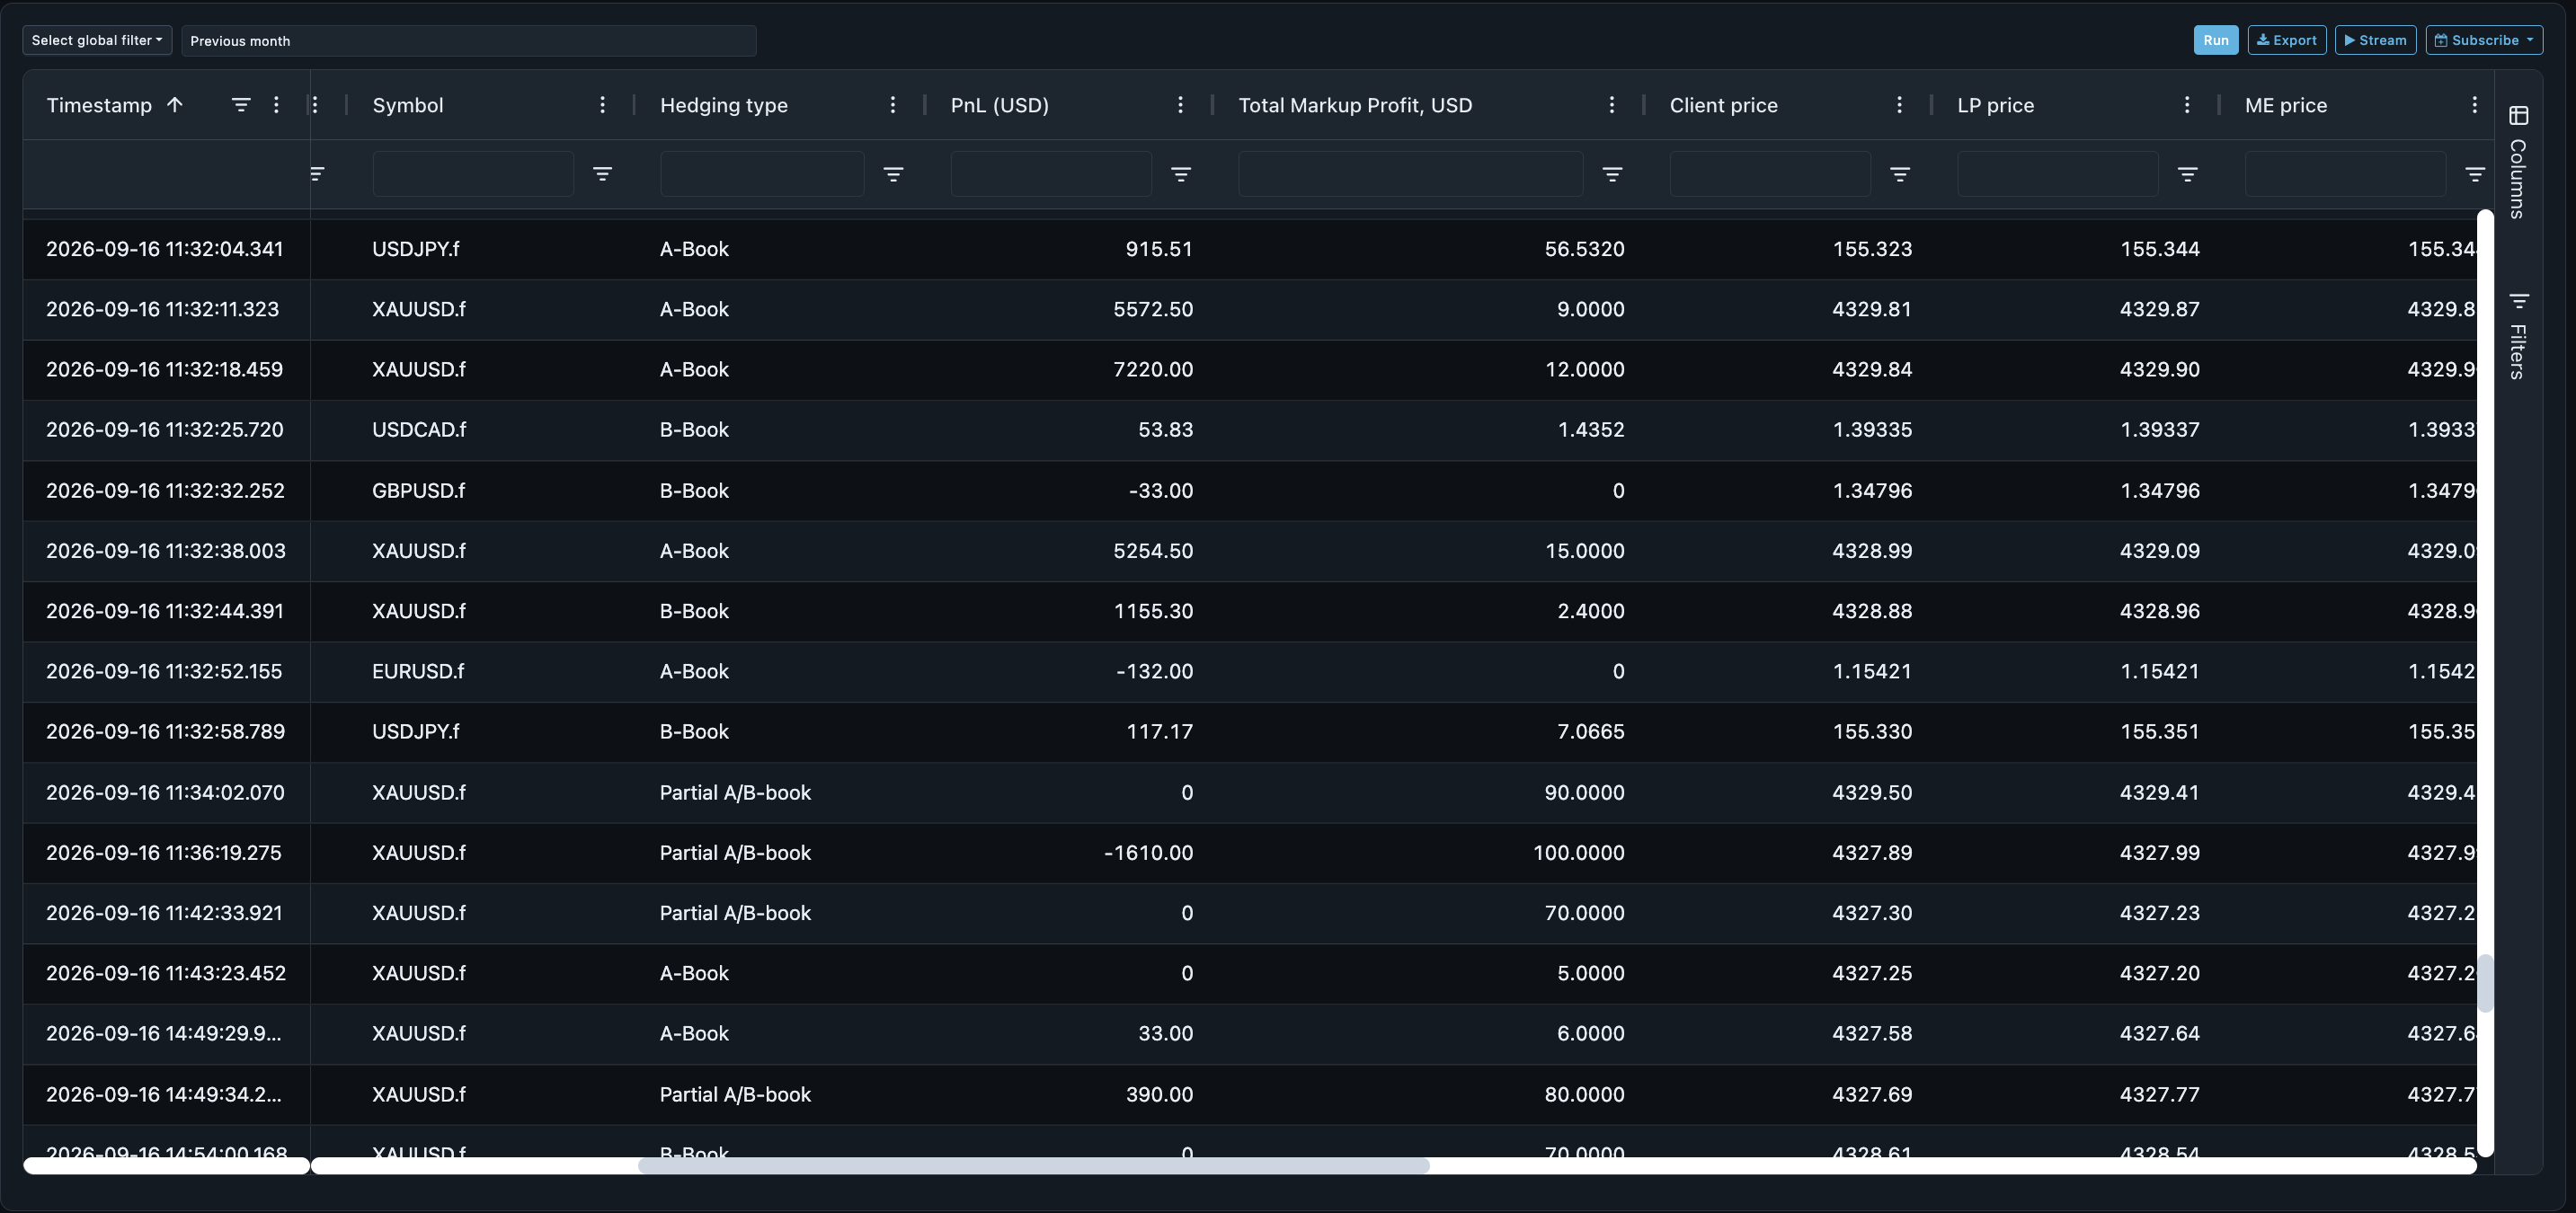
The Trade Blotter, available under Monitoring, provides historical and live trade-level records across supported MT4, MT5 and FIX environments. Users can select a date range, apply filters and export data for further analysis.
Move from the aggregated P&L result to the exact trades and execution conditions behind it.
3. Liquidity-provider competitiveness: Are your input prices and execution costs still competitive?
What to monitor
Liquidity is a major input into A-book execution and the reference pricing used across the brokerage. Compare:
- Bid and ask prices across LPs
- Spreads over the same periods
- Depth available at relevant ticket sizes
- Gaps or interruptions in pricing
- The price received from LPs with the price distributed to clients
How to interpret it
An LP’s competitiveness varies by symbol, session and volume. Look for persistent differences under comparable conditions, not isolated ticks.
Example: If an LP’s effective hedge cost is consistently higher on comparable EUR/USD tickets, quantify the difference per million traded before testing priority changes. Compare depth, fills, slippage and rejections, not just quoted spread.
How Your Bourse supports the review
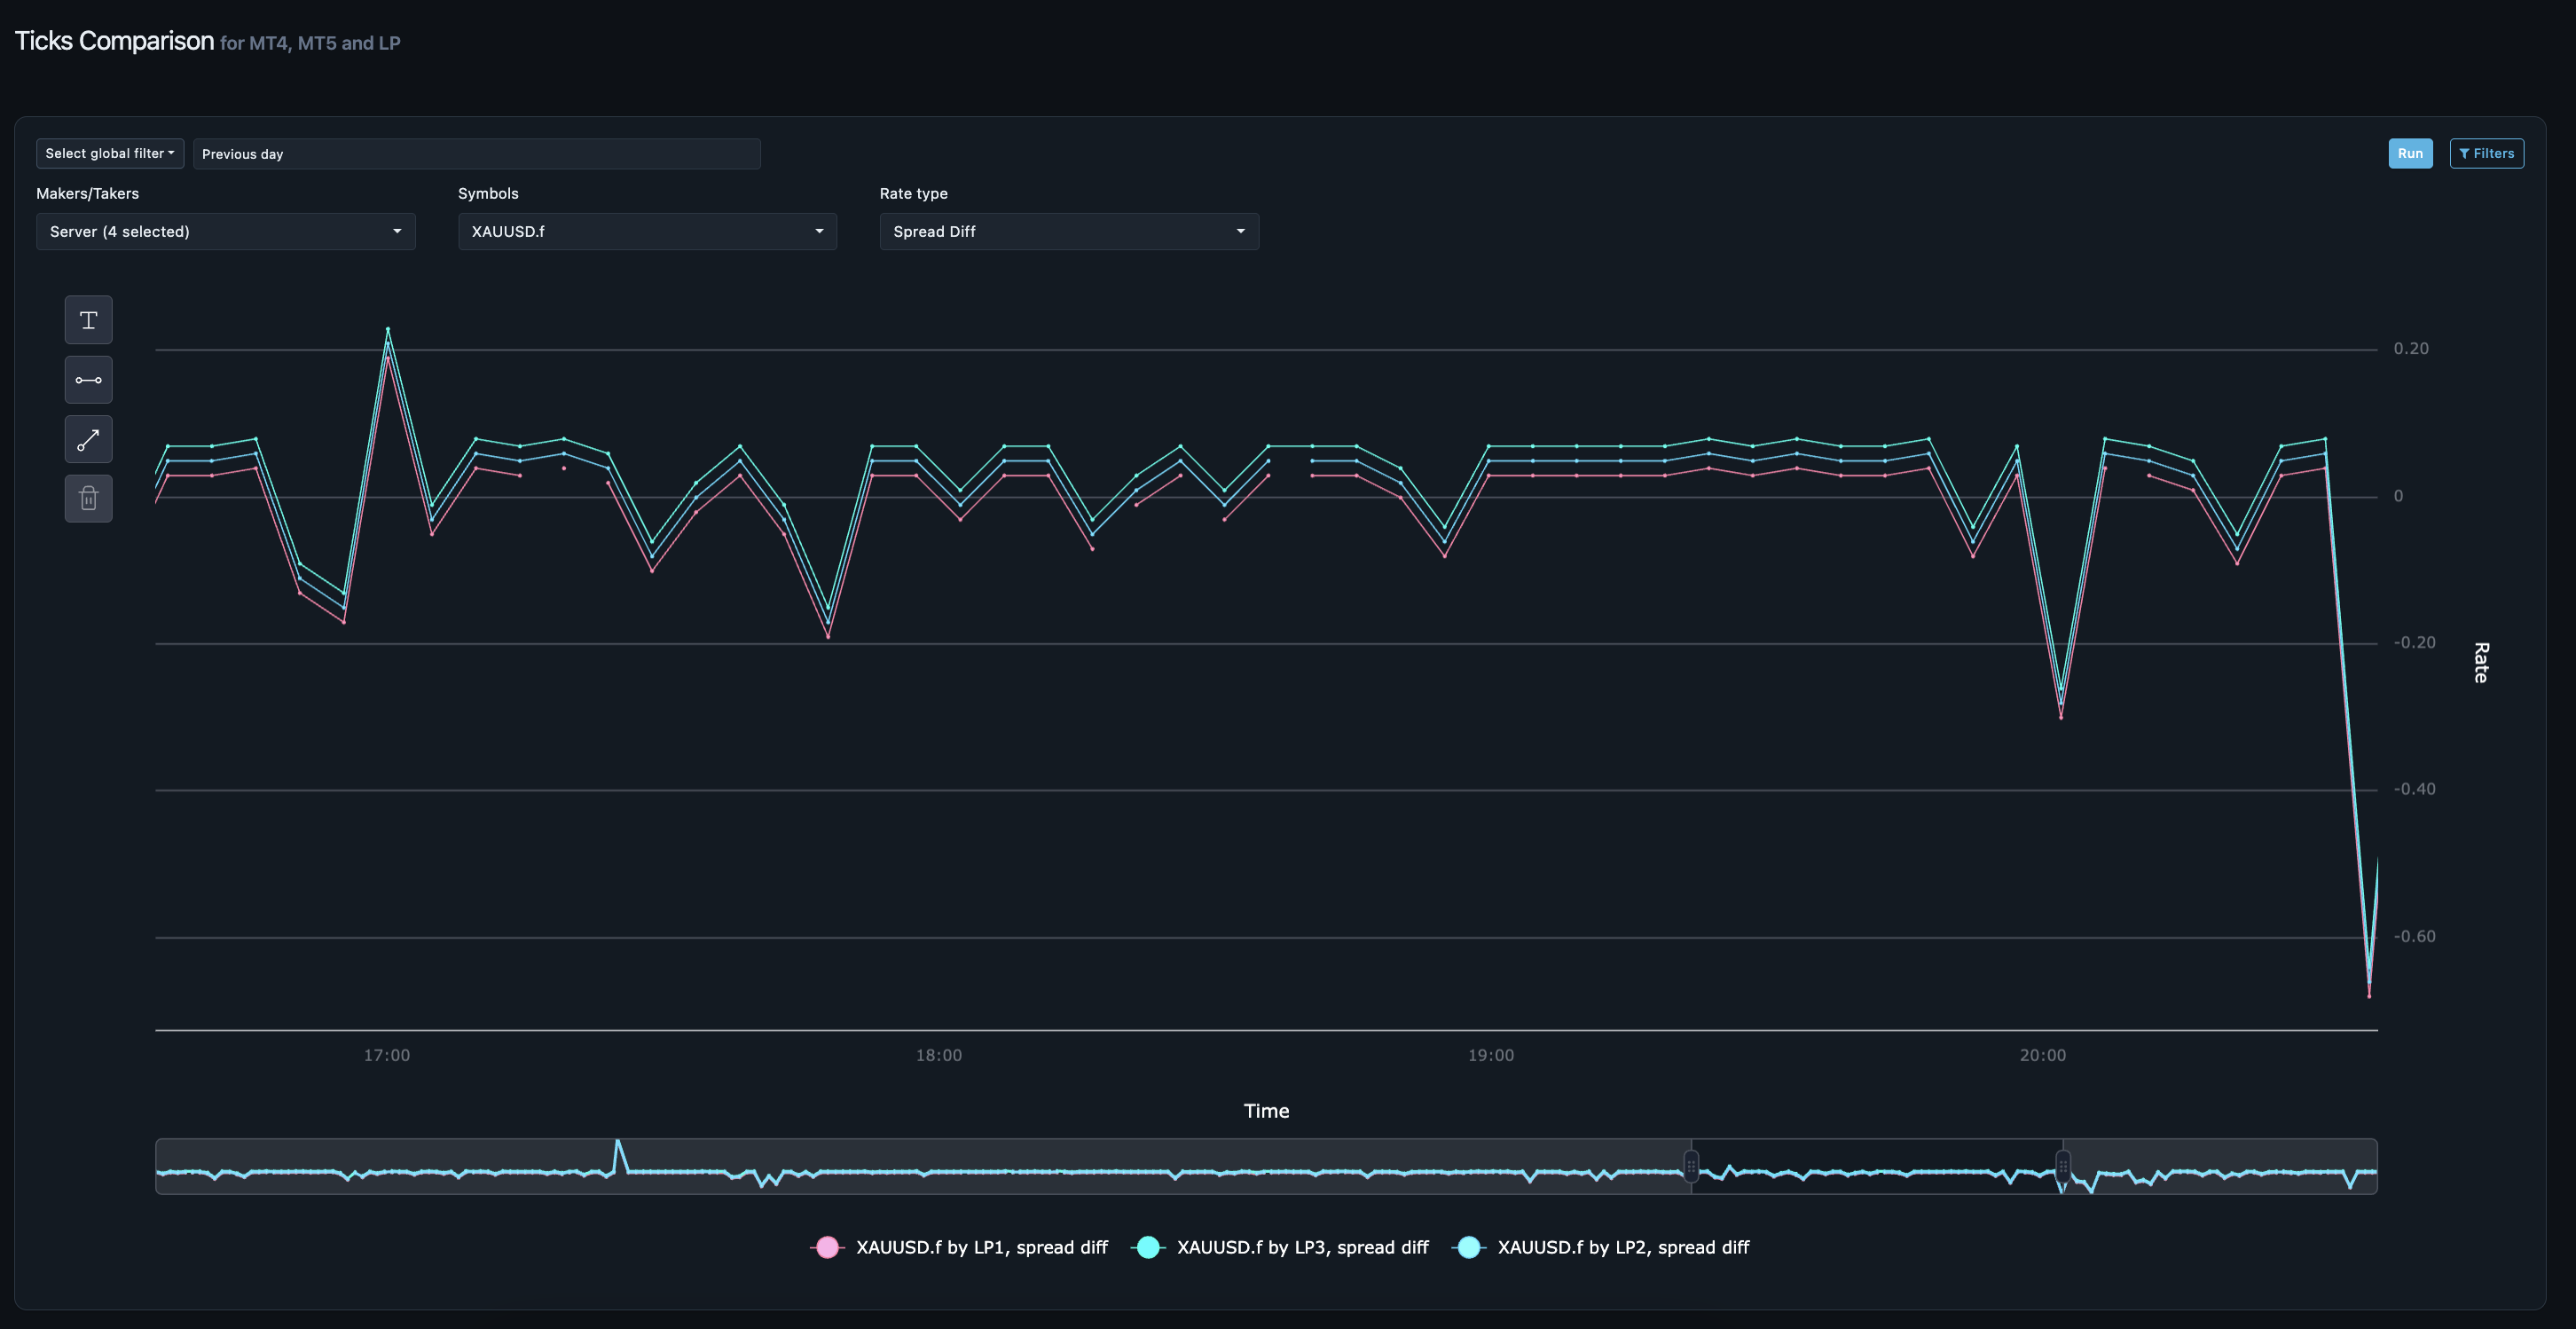
The Ticks Comparison Chart displays bid, ask and spread data side by side across liquidity providers and MT4/MT5 servers.
It is available under:
Reports → General → Liquidity for LP-side comparison
Reports → General → Analytics for MT4/MT5-side comparison
If the analysis shows that relying on one source is producing weaker prices or resilience, the team can review its liquidity-pool configuration. LPs at the same priority can contribute to a composite order book; separate tiers can be used for primary and failover logic.
Aggregation is the corrective control. The comparison data is what establishes whether a change should be considered.
Compare liquidity sources over equivalent market conditions before changing aggregation or priority settings.
4. Spread-markup revenue: Is the pricing configuration producing the expected return?
What to monitor
Review how much revenue is generated by each pricing component, including:
- Symbol
- Taker and maker side
- Group markup
- Bid/ask markup
- Minimum and maximum spread markup
- Other configured markup components
How to interpret it
Realised markup depends on actual volume, ticket sizes, symbol mix and applied pricing rules. Check whether those rules work as intended and produce an appropriate return. Low revenue may reflect client activity or deliberate pricing, not an error.
Example: If realised markup falls below forecast, compare actual volume and ticket sizes with the configured pricing rules before increasing rates. The difference may reflect trade mix, rule application or a deliberate concession.
How Your Bourse supports the review
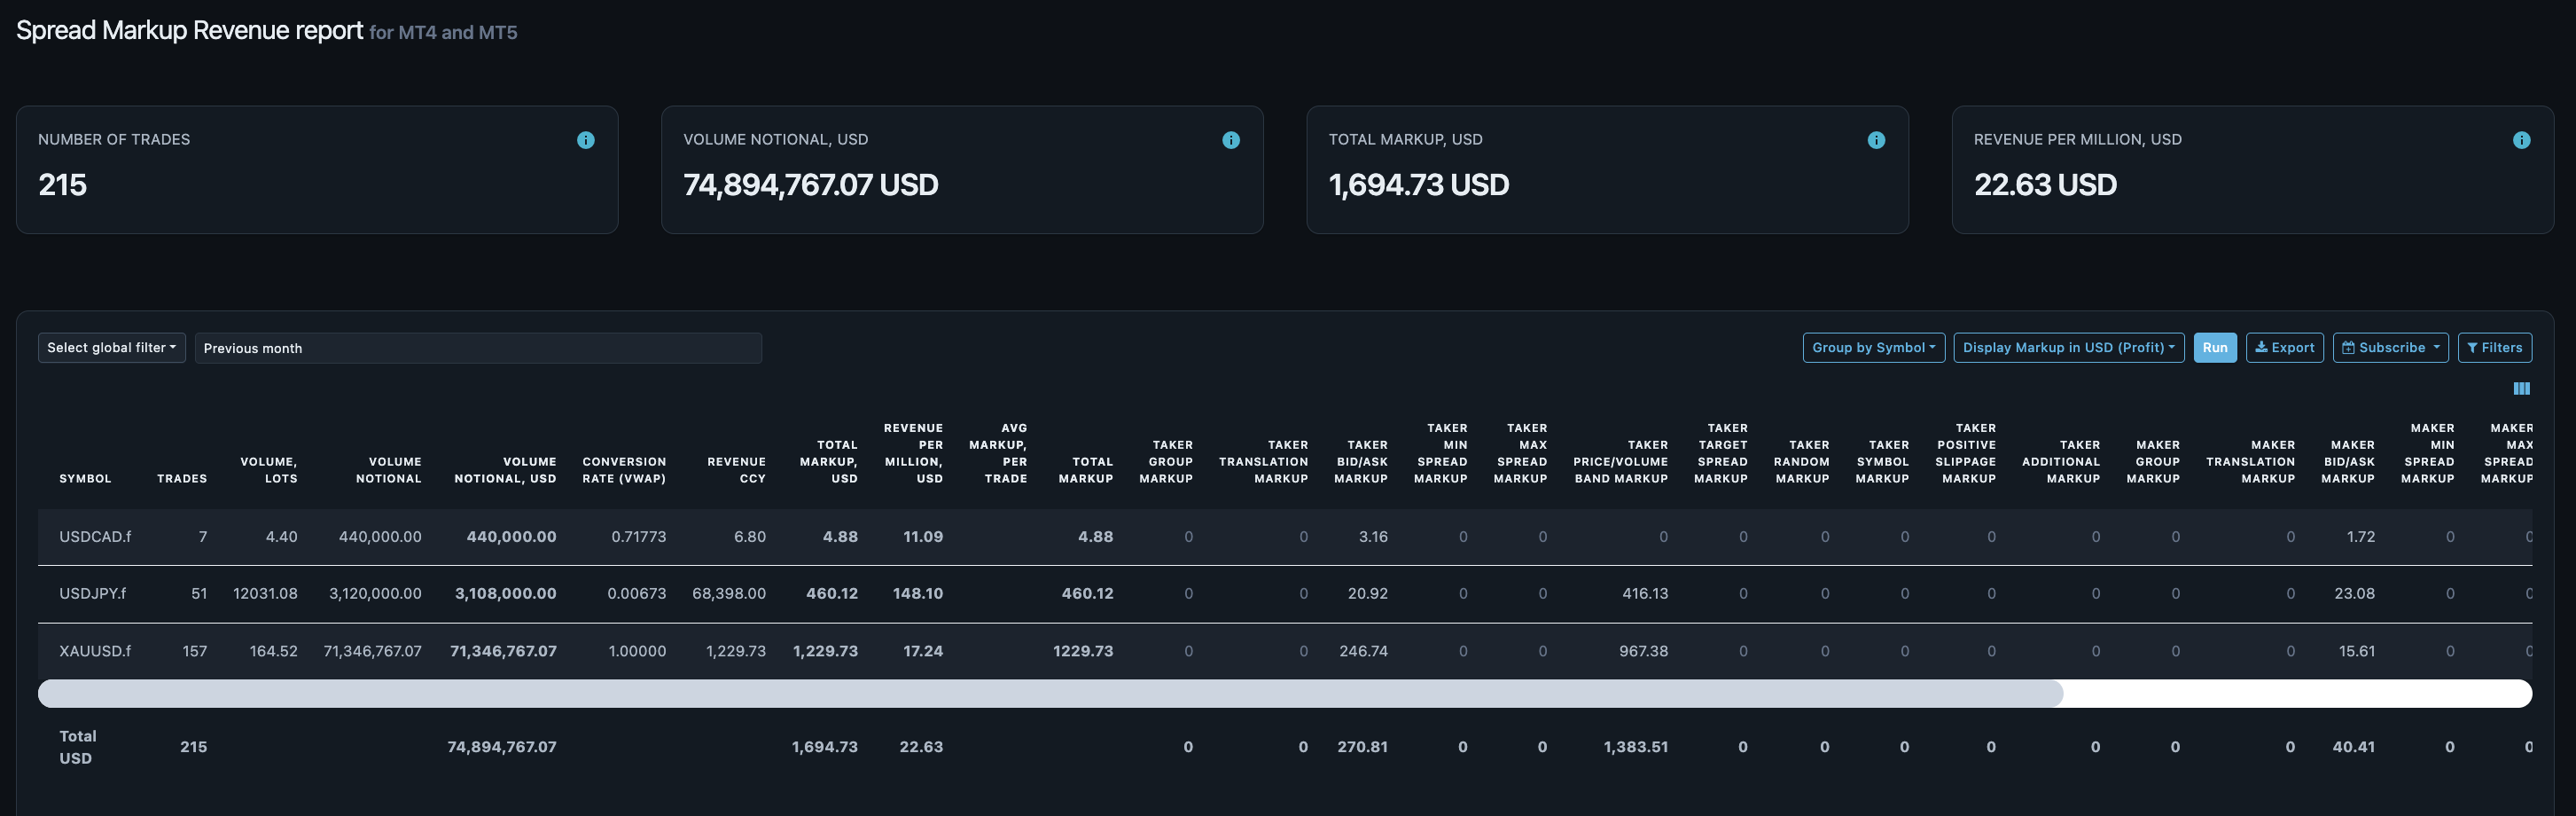
The Spread Markup Revenue Report, under Reports → General → Profit and Loss, shows the contribution of the configured markup components.
The underlying pricing controls include:
- Base Markup
- Bid/Ask Markup
- Target Spread
- Price Markup per Volume Band
- Execution Volume-Based Markup
These settings can be applied at account or group level within the relevant Bridge/Gateway pricing configuration.
Volume bands allow the pricing approach to reflect ticket size rather than applying one uniform setting to every trade. Execution price bands can apply an additional markup during execution without adding that component to the quoted price. The appropriate configuration depends on the broker’s pricing model and client obligations.
Reconcile the pricing rules configured in the platform with the revenue they generate in practice.
5. Client and IB contribution: Which relationships create value after their full costs?
What to monitor
Headline trading revenue does not show the complete commercial value of a client segment or IB relationship. Where the data is available, assess:
- A-book and B-book P&L by client group or IB
- Markup and commission revenue
- Rebates and other acquisition costs
- Swap contribution
- Trading volume and activity pattern
- Operational or risk implications
How to interpret it
High volume can produce weak net contribution after execution costs and rebates. Review meaningful periods before changing routing.
Example: Two IBs generating equal volume may produce different net contributions after rebates and execution costs. Compare those components before reviewing commercial terms or routing.
How Your Bourse supports the review
The P&L by IB reports help compare financial contribution across partner relationships. Order Routing can then apply routing actions based on defined criteria such as account equity, trading volume, symbol, account or group attributes, and combinations of conditions.
Routing is a control, not the measurement itself. Any change should follow analysis and the broker’s internal risk policy.
6. Client-flow quality: Is the book exposed to behaviour that may become unprofitable?
What to monitor
P&L is backward-looking. Behavioural alerts and markouts can provide earlier evidence that certain flow deserves attention.
Relevant behavioural signals may include:
- Unusually large individual orders
- High-frequency activity within a short period
- Very short holding periods
- Repeated trading around fast price movements
- Consistent post-trade price movement in the client’s favour
Client Alerts: identify behaviour for investigation
Your Bourse Client Alerts can flag configured patterns such as large orders, high-frequency activity, scalping behaviour and positions closed faster than a defined threshold. Alerts can be reviewed in real time or historically and configured by group or account.
An alert is not proof of abuse. It identifies activity that warrants analysis.
Markouts: measure what happened after execution
A markout compares the execution price with the market price at selected intervals before and after the trade. Repeated adverse markouts can help reveal:
- Flow that consistently benefits from subsequent price movement
- Latency-sensitive strategies
- Possible execution-quality issues
- Patterns requiring deeper client or LP analysis
The Markouts Report and Markouts Aggregated View are available under Reports → General → Analytics.
Client Alerts answer “Which behaviour should we examine?” Markouts help answer “Did the timing of this flow create a repeatable pricing disadvantage?”
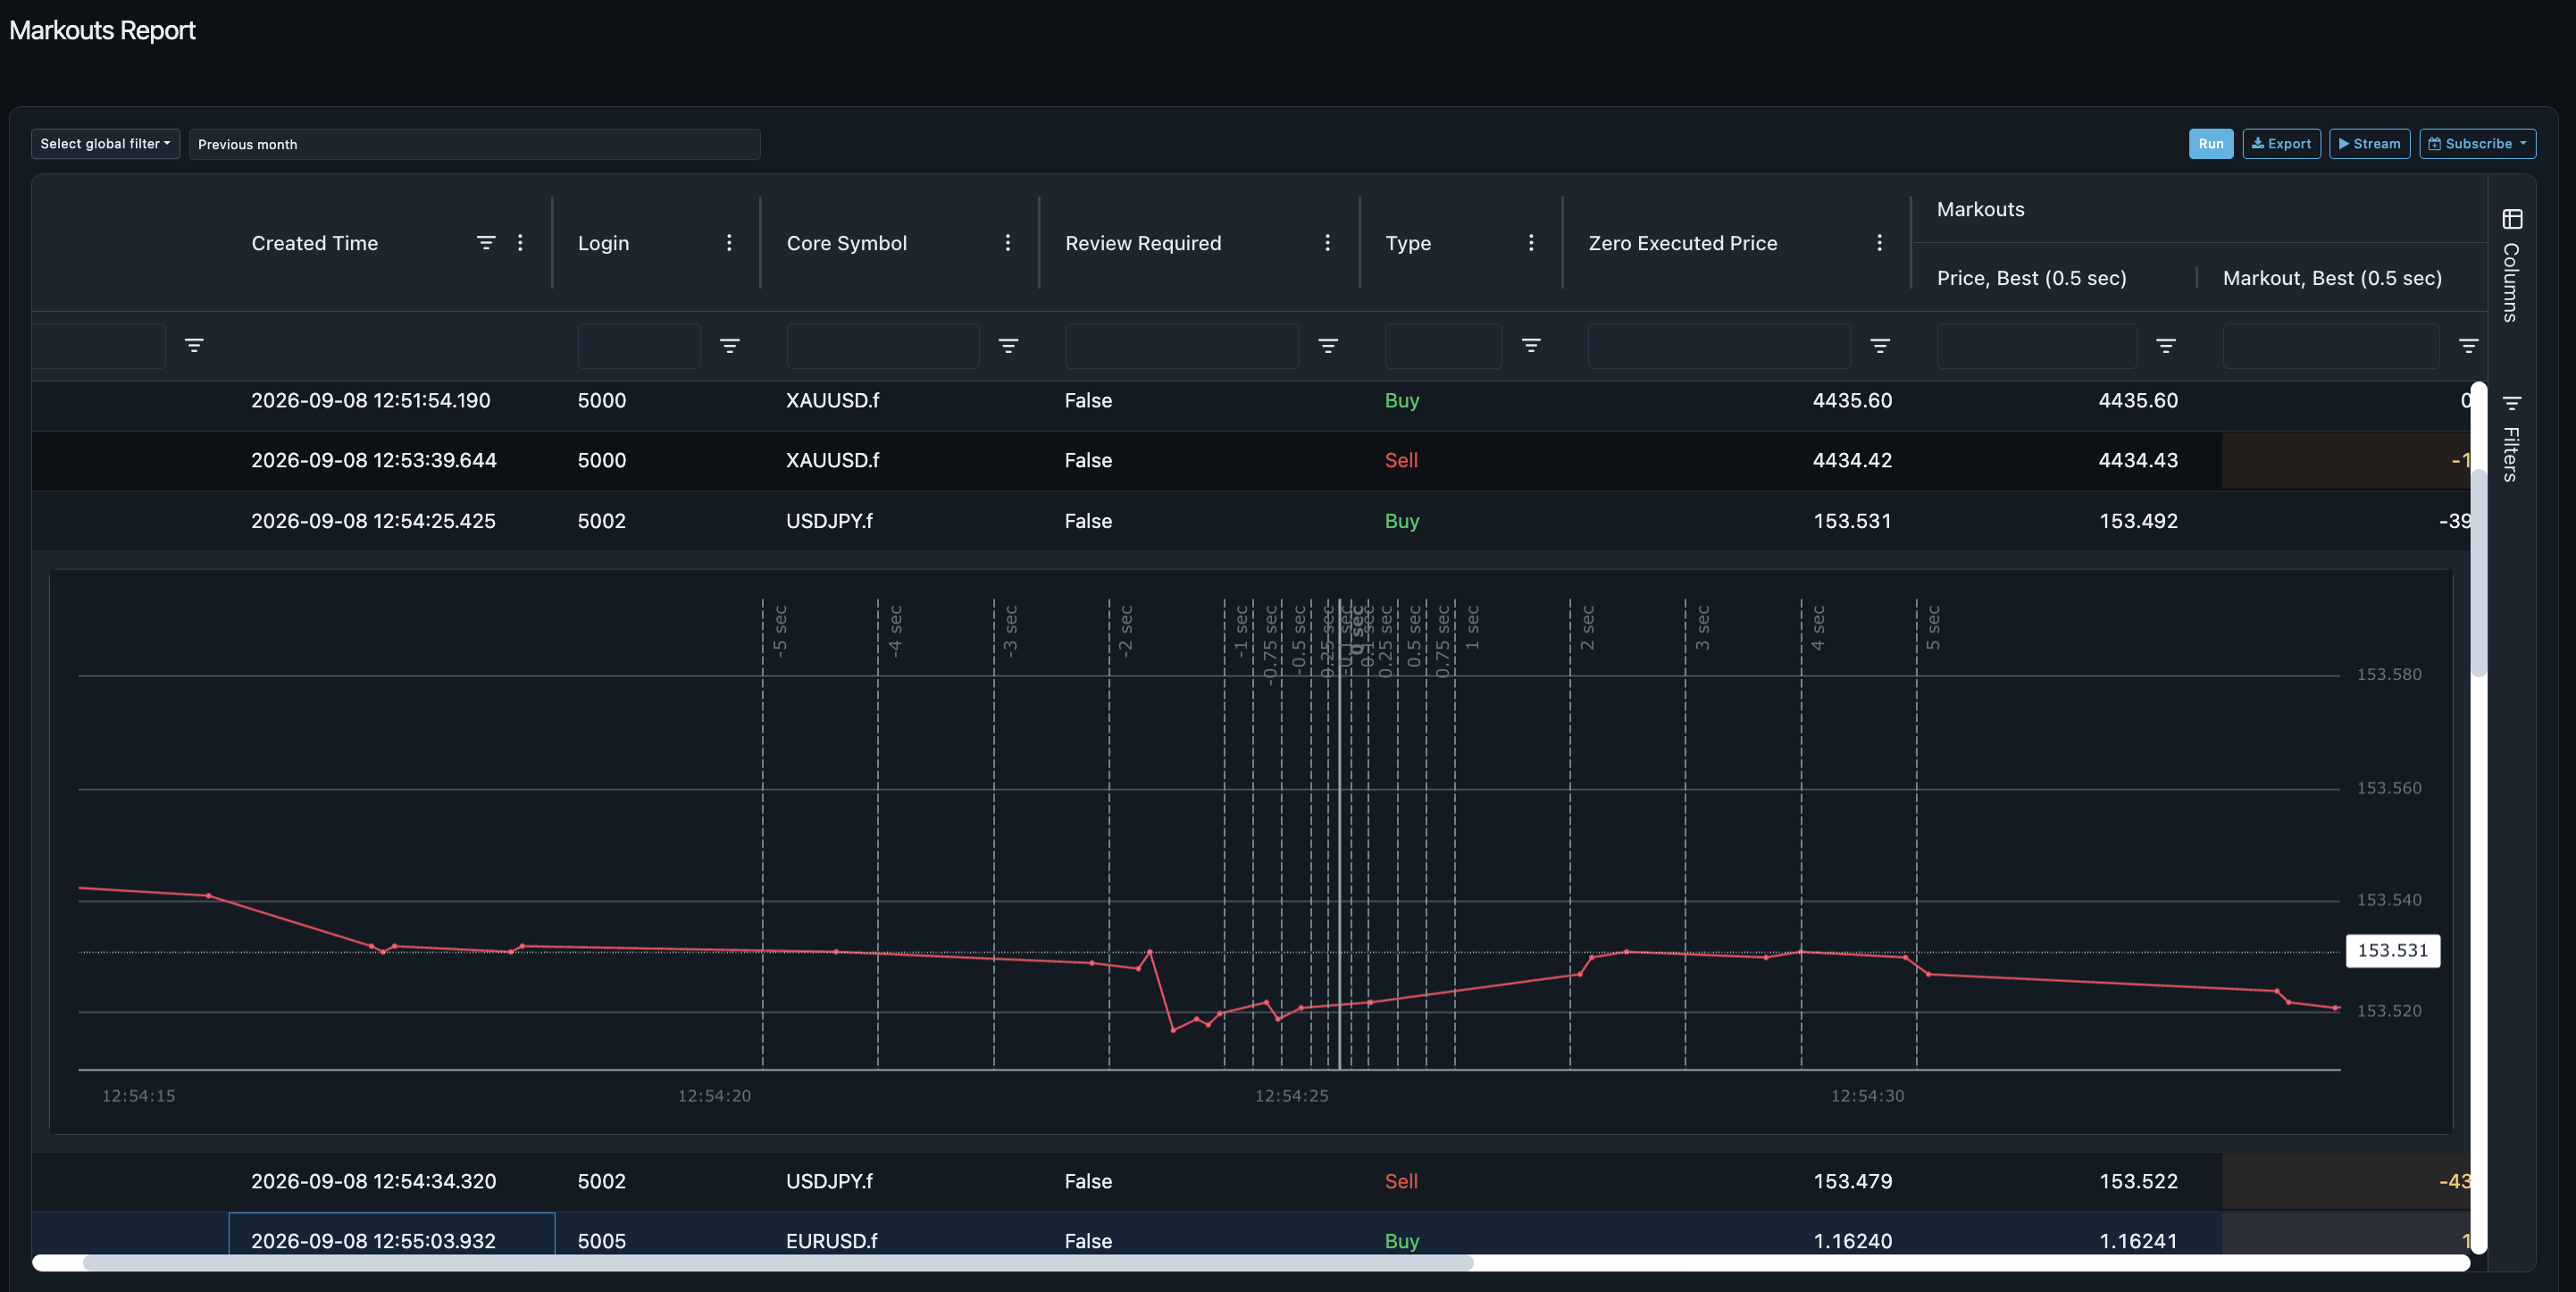
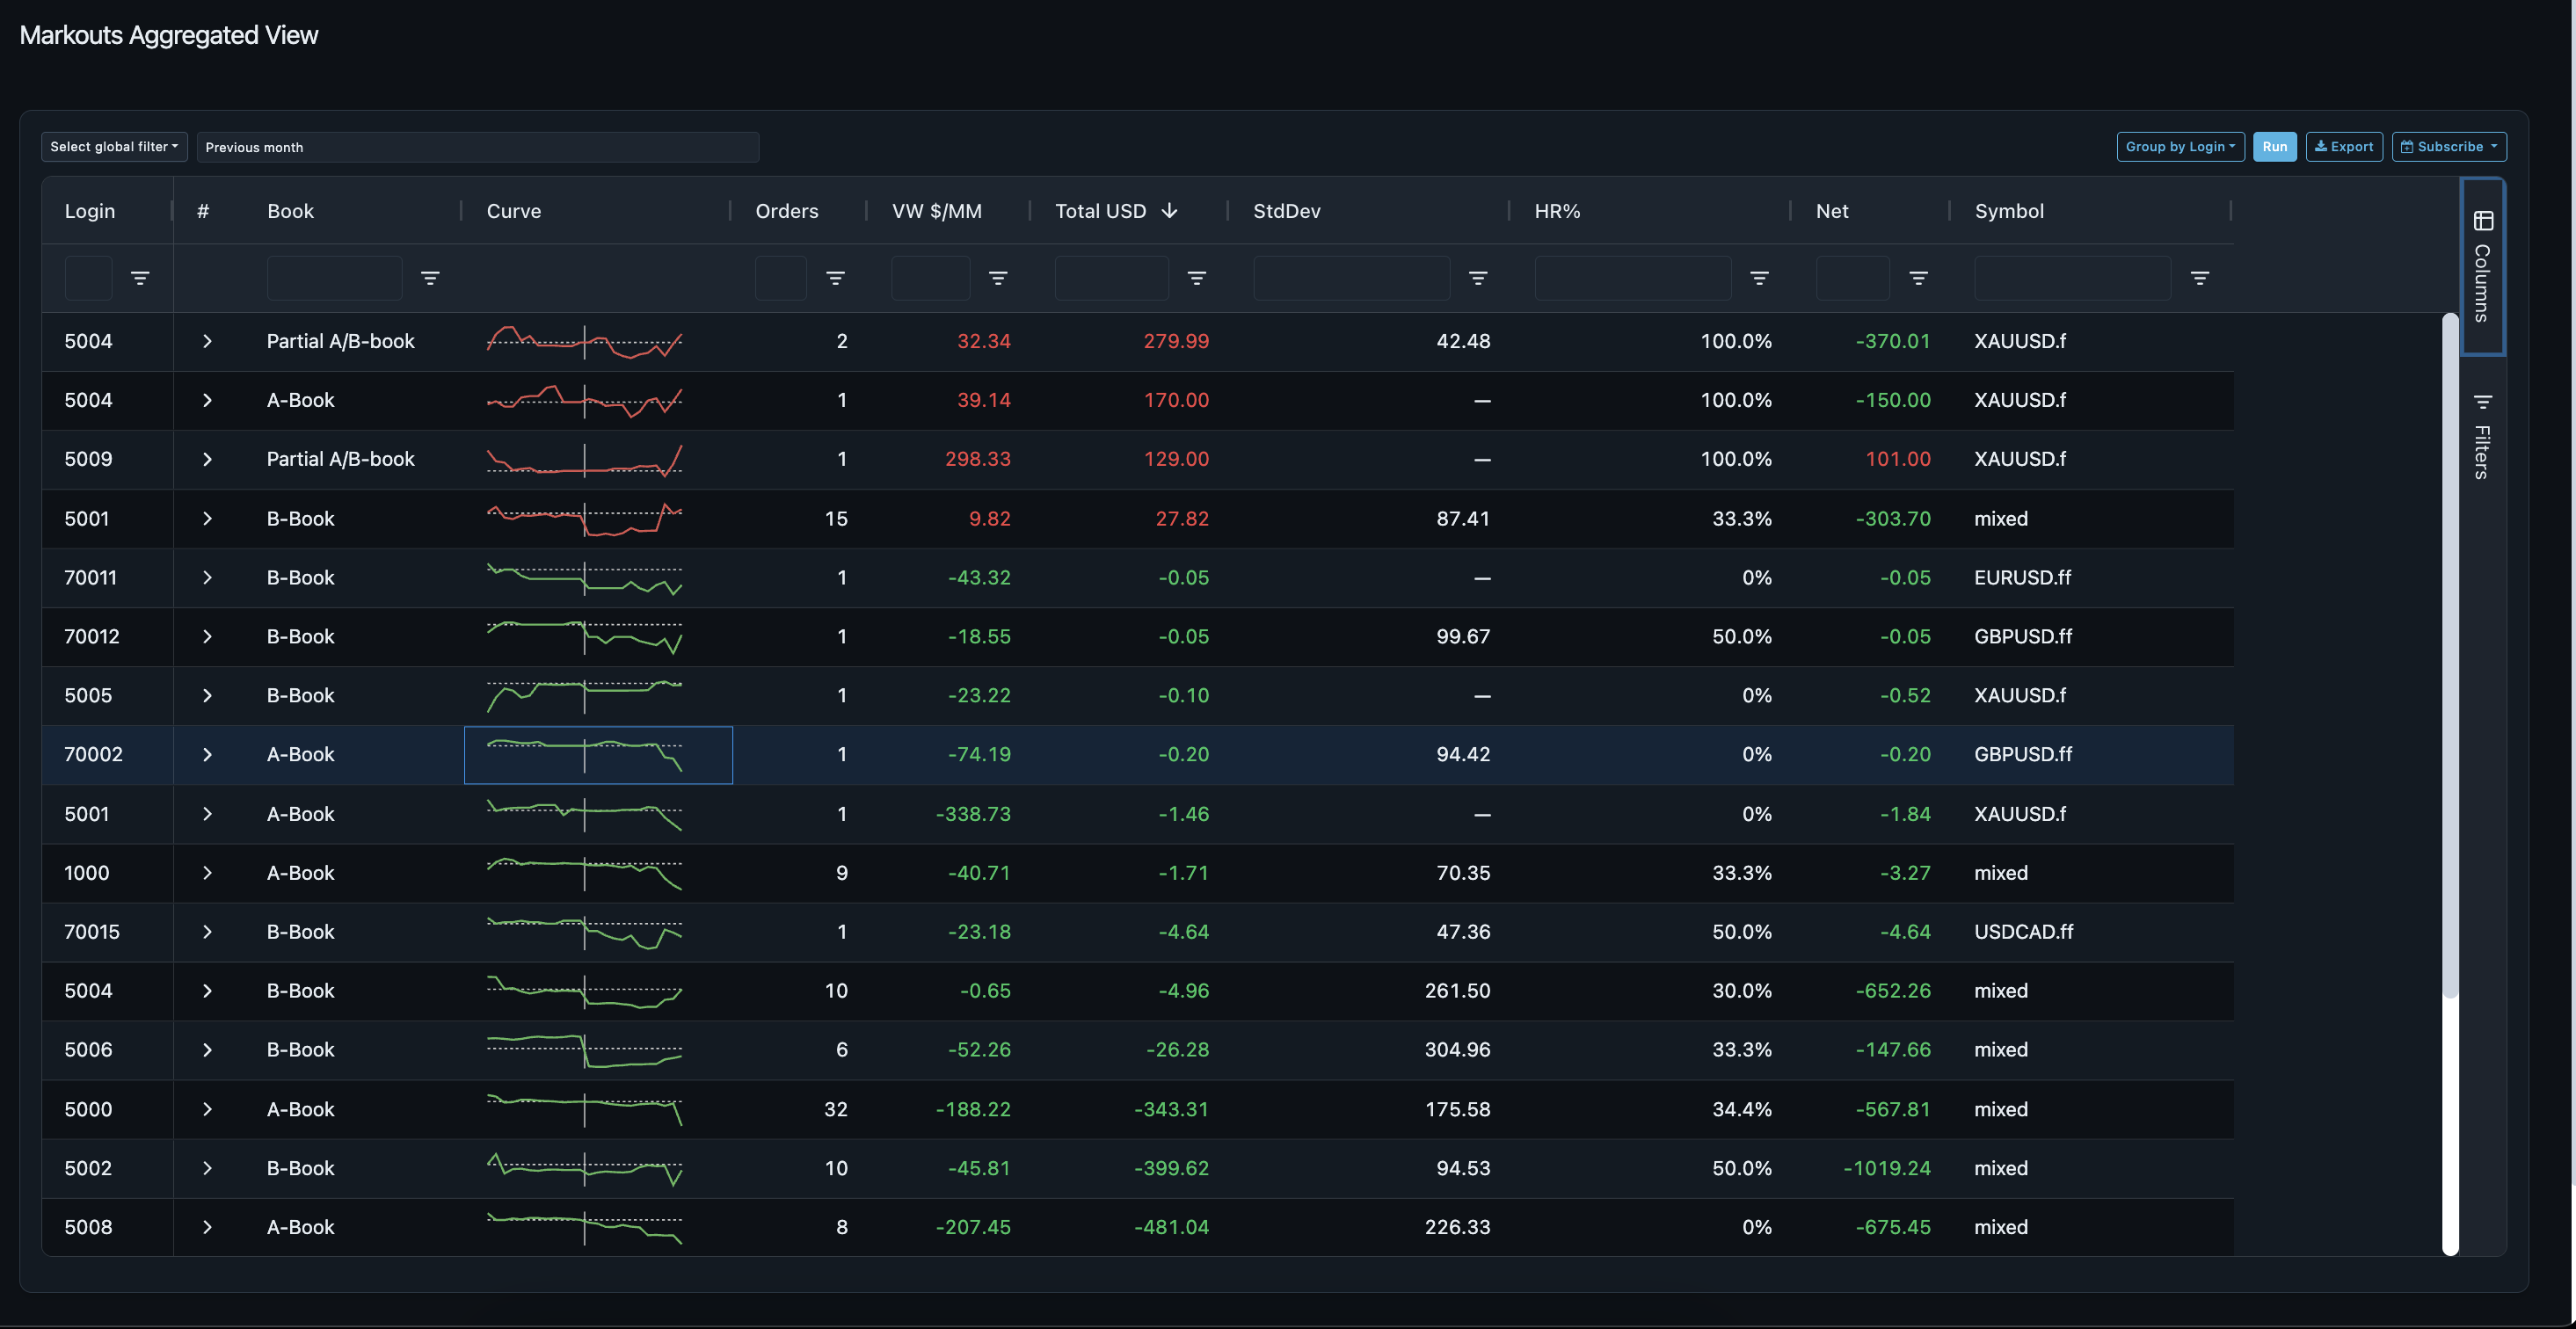
Look for repeatable patterns across sufficient observations, not one favourable trade.
7. Risk-control effectiveness: Are routing and execution settings addressing the problem identified?
After the analysis reveals a repeatable issue, the team can review the relevant control. Depending on the cause, that might include:
- Changing an LP’s aggregation or priority
- Reviewing pricing and volume bands
- Adjusting account- or group-level routing
- Introducing closer behavioural monitoring
- Reviewing execution timing and Last Look conditions
Execution Delay and Last Look
The ExecutionDelay parameter introduces a configured hold before an order is executed and can be set by symbol, group or account. Associated Last Look conditions can evaluate market movement during that period and reject an order when the configured conditions are met.
These controls may help protect relevant flow from execution at a stale price, including in latency-arbitrage scenarios. They should be configured deliberately, tested and used consistently with the broker’s execution policy and regulatory obligations.
In Your Bourse, ExecutionDelay and the associated Last Look conditions are configured within the MT4 Bridge or MT5 Gateway.
Measure again after any change
After a change, measure:
- P&L by book, symbol and group
- Execution and slippage
- Markup revenue
- Client behaviour and markouts
- Rejection patterns and client impact
The review process is a loop: measure → investigate → adjust → measure again.
Practical example: a potential $15,000 monthly profit opportunity
Hypothetical illustration, not a verified customer result.
Suppose a brokerage processes $75 billion per month and sees A-book P&L weaken on a high-volume symbol despite stable infrastructure.
- Identify: Isolate the symbol, book and period in P&L reporting.
- Investigate: Use the Trade Blotter to examine client and hedge execution, slippage and LP details.
- Compare: Check LP prices against depth, fill quality and rejections in equivalent market conditions.
- Test: If the evidence supports it, trial an LP-priority or liquidity-pool change and measure its net effect, including client impact.
- Quantify: A verified $0.20 improvement per million across the full $75 billion monthly volume would equal $15,000 per month or $180,000 annually. The benefit would be lower if only some flow improved.
The opportunity exists only if a repeatable net improvement is demonstrated, not merely because a dashboard suggests a wider spread.
A practical monthly profitability review
A brokerage can turn these reports into a repeatable monthly process:
- Review total, A-book and B-book P&L.
- Identify material changes by symbol, group and IB.
- Investigate unusual results in the Trade Blotter.
- Compare LP pricing and distributed pricing over relevant periods.
- Reconcile markup configuration with realised markup revenue.
- Review behavioural alerts and aggregated markouts.
- Agree any pricing, liquidity, routing or execution changes.
- Assign an owner and record the reason for each change.
- Measure the same segment again after implementation.
This turns reporting into a repeatable decision process.
Where could your brokerage be losing profit?
Operational stability does not guarantee profitability. Your Bourse connects P&L, trade-level execution, liquidity, markup and client-flow analysis with the controls teams can review and validate. The aim is to move from a financial signal to an informed decision, then measure its result.
Book a 60-minute brokerage profitability review with Furqan or a Your Bourse specialist.

Where could your brokerage be leaving profit on the table? In a focused review, we will discuss five common sources of potential profit leakage and show how to investigate the ones most relevant to your setup.
You'll leave with:
- A practical checklist covering P&L, execution, liquidity, markup and client-flow analysis.
- Examples of the reports and controls to examine in Your Bourse.
- A recommended starting point for your dealing team’s next investigation.
This is an educational diagnostic conversation, not a full infrastructure audit, a guaranteed finding or a promise of savings.