Dashboard
The Dashboard can be found by selecting the YourBourse icon in the cloud portal. There are currently seven main components to the dashboard including Components State, and Market Watch.
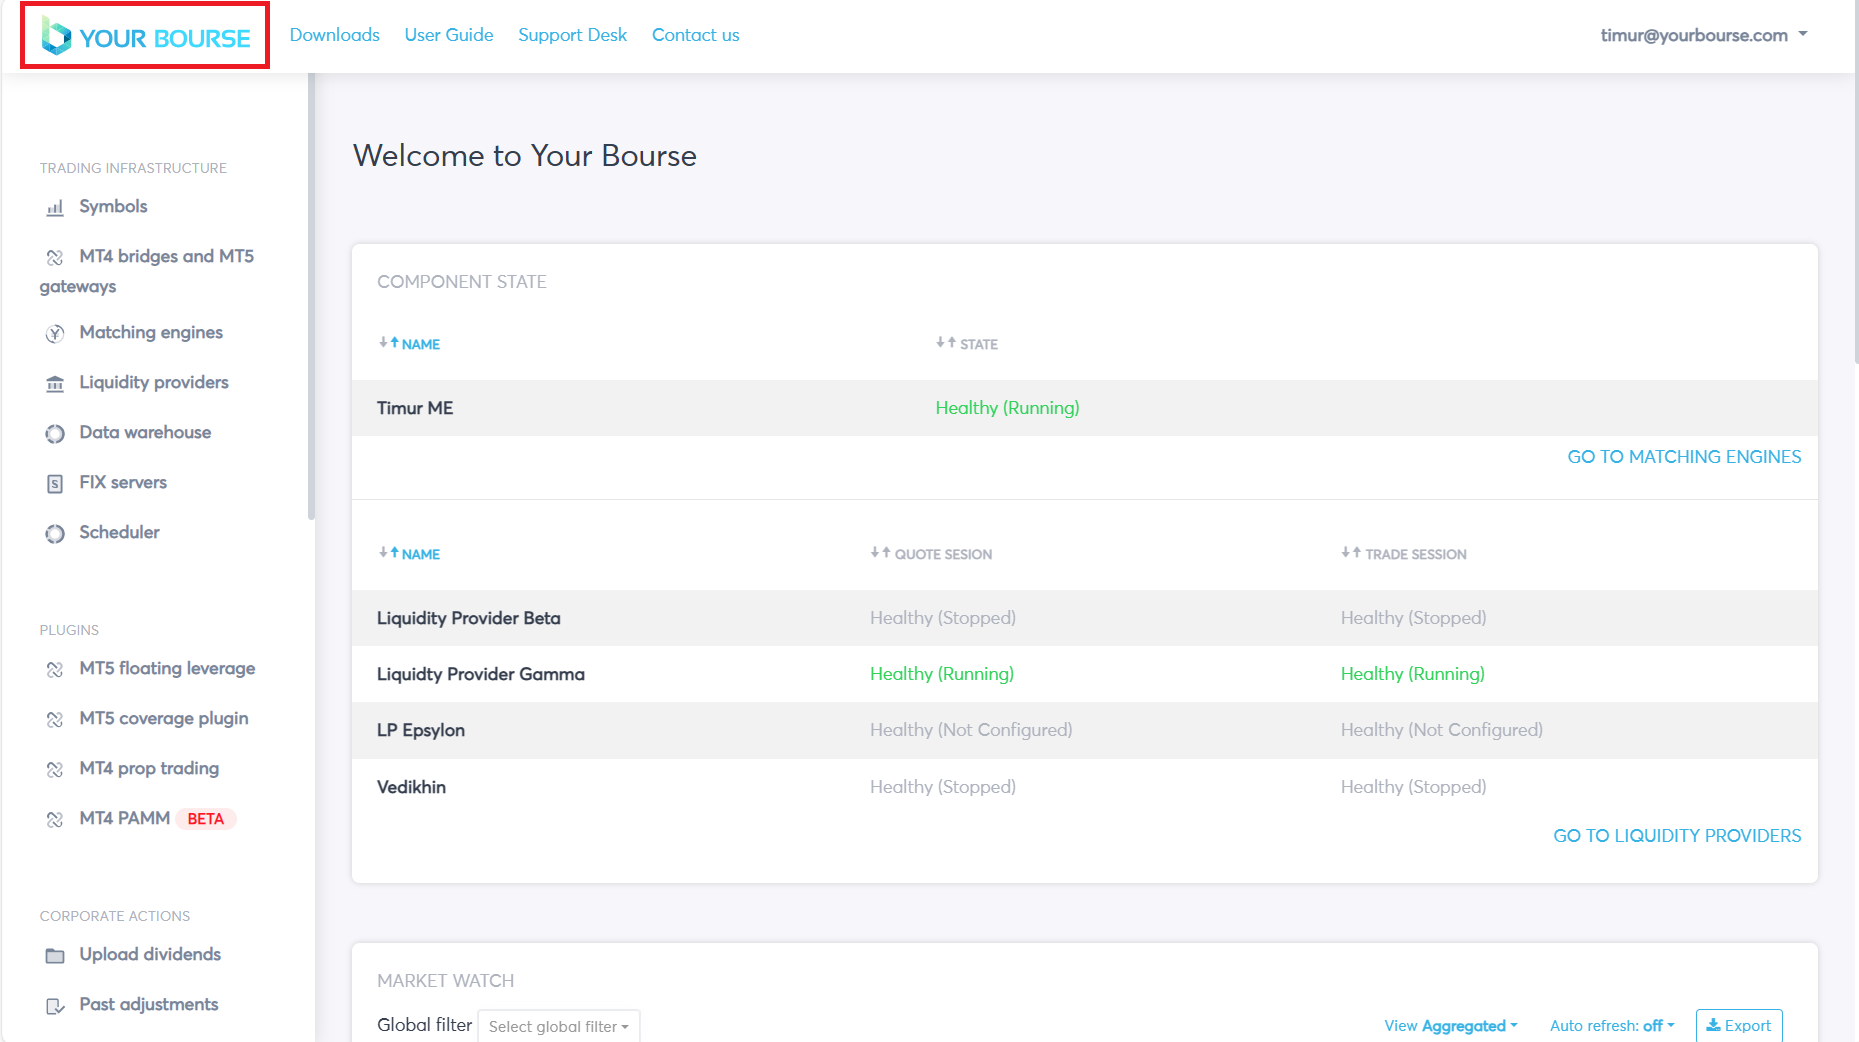
Component State
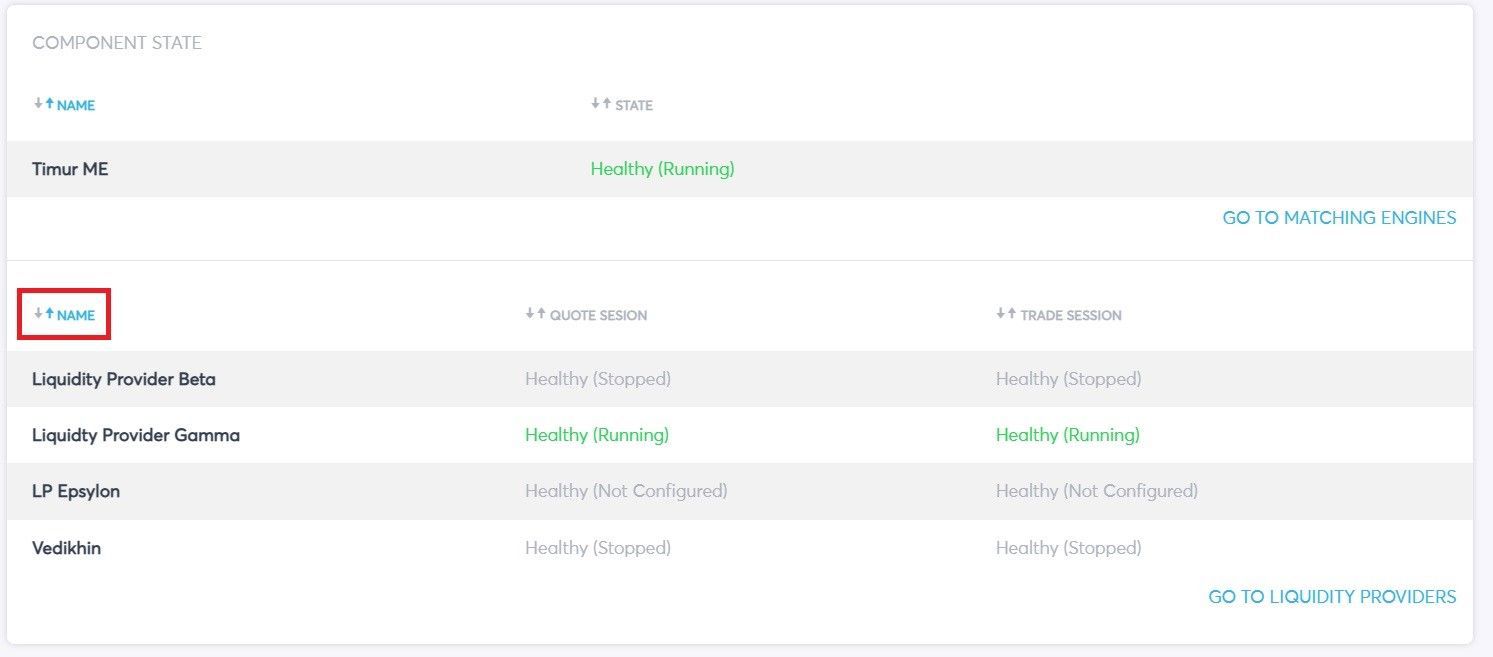
The “Component State” feature of the dashboard displays lists of configured matching engines and liquidity providers, to configure liquidity providers or matching engines please go to their respected user guides.
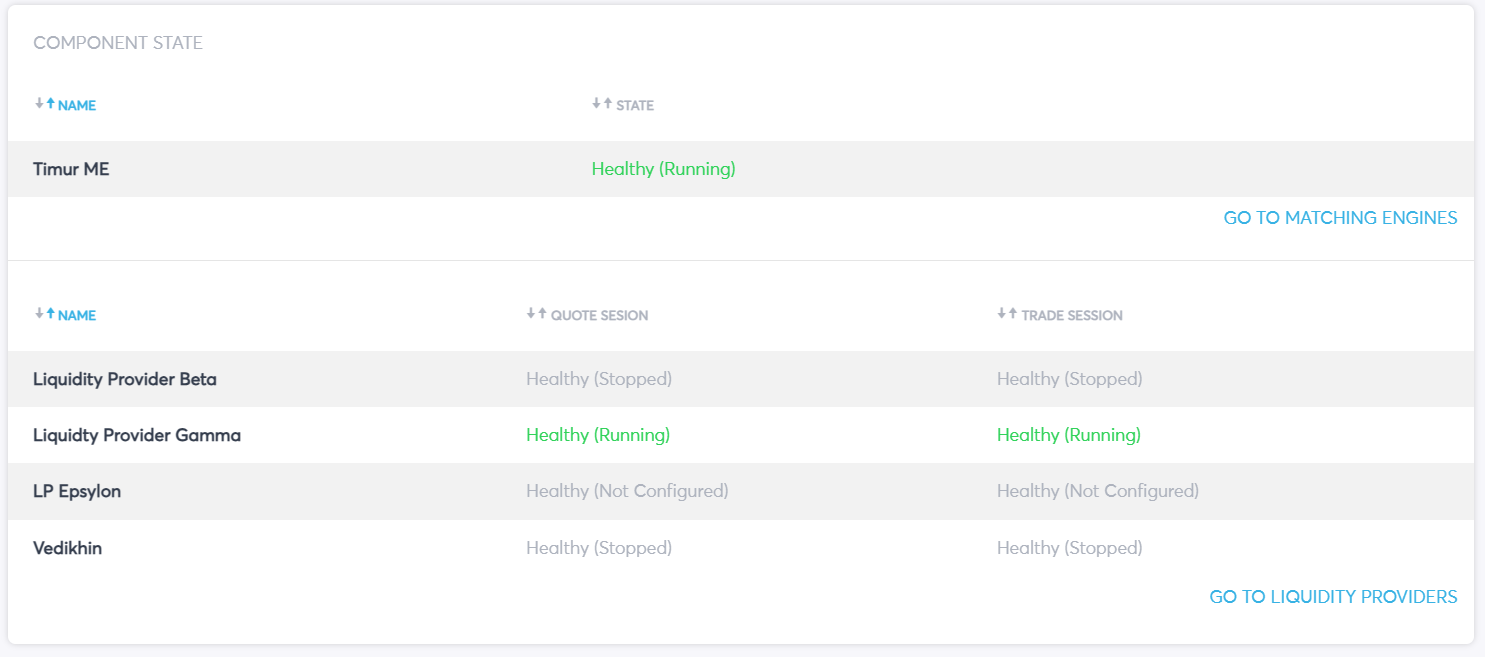
The matching engine name and state is shown in the first section of the display. There are several “states” that can be displayed for both the matching engine and liquidity providers including:
-
Healthy (Running) - a component is up and running.
-
Healthy (Stopped) - a component was stopped by a user and doesn’t operate now.
-
Healthy (Not Configured, only for Liquidity Provider) - quote/trade session for the liquidity provider is not created.
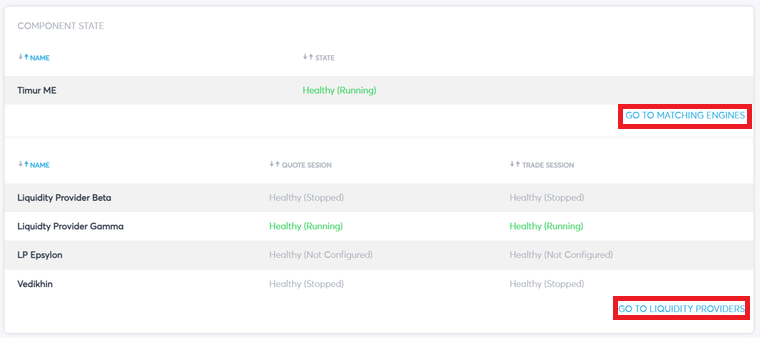
Matching engines and Liquidity providers can be accessed directly from the dashboard by selecting “GO TO MATCHING ENGINES” or “GO TO LIQUIDITY PROVIDERS”.
Similarly to the matching engines the liquidity providers are shown in three columns with the name, quote session status and trade session status being displayed.
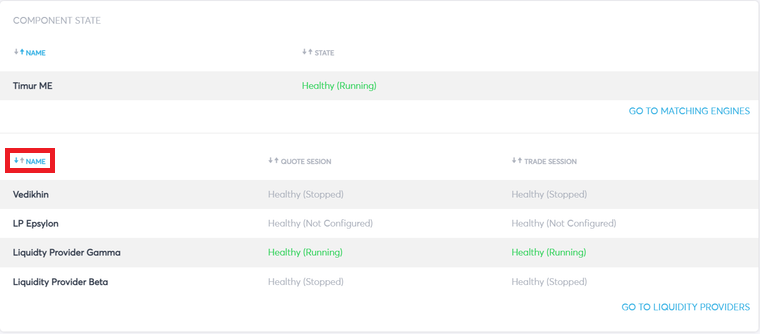
The Component state feature lists all the liquidity provider and matching engine names in alphabetical order, the user can change this by selecting the column heading as shown.
Market Watch
The Market Watch follows a very similar structure to the Trade Blotter. The feature contains a main table that displays a configured symbol followed by several parameters in the consecutive columns. To configure the displayed parameters the “Column” or “Filters” icons can be selected, similarly a global filter can be enabled, all these customizations are explained in the Trade Blotter user guide under the section “Trade Blotter Filters” .
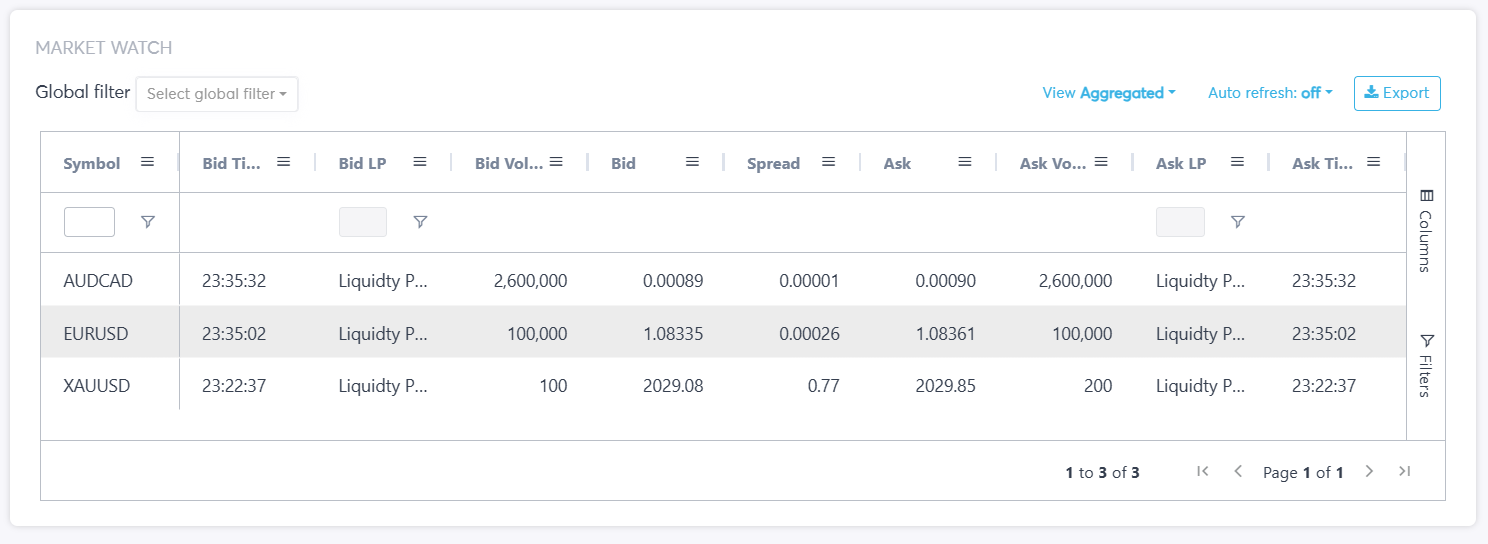
The parameters can be defined by:
-
Bid Time - the exact time that the bid data is taken from Liquidity Provider(s)
-
Bid LP - the name of the chosen LP the bid price data is supplied from
-
Bid Volume - the volume in lots of the symbol at a bid price
-
Bid - the LP bid price
-
Spread - the difference between the bid and ask price for a particular symbol for a specific LP
-
Ask - the LP ask price
-
Ask Volume - the volume in lots of the symbol at a ask price
-
Ask LP - the name of the chosen LP the ask data is supplied from
-
Ask Time - the exact time that the ask data is taken from LP
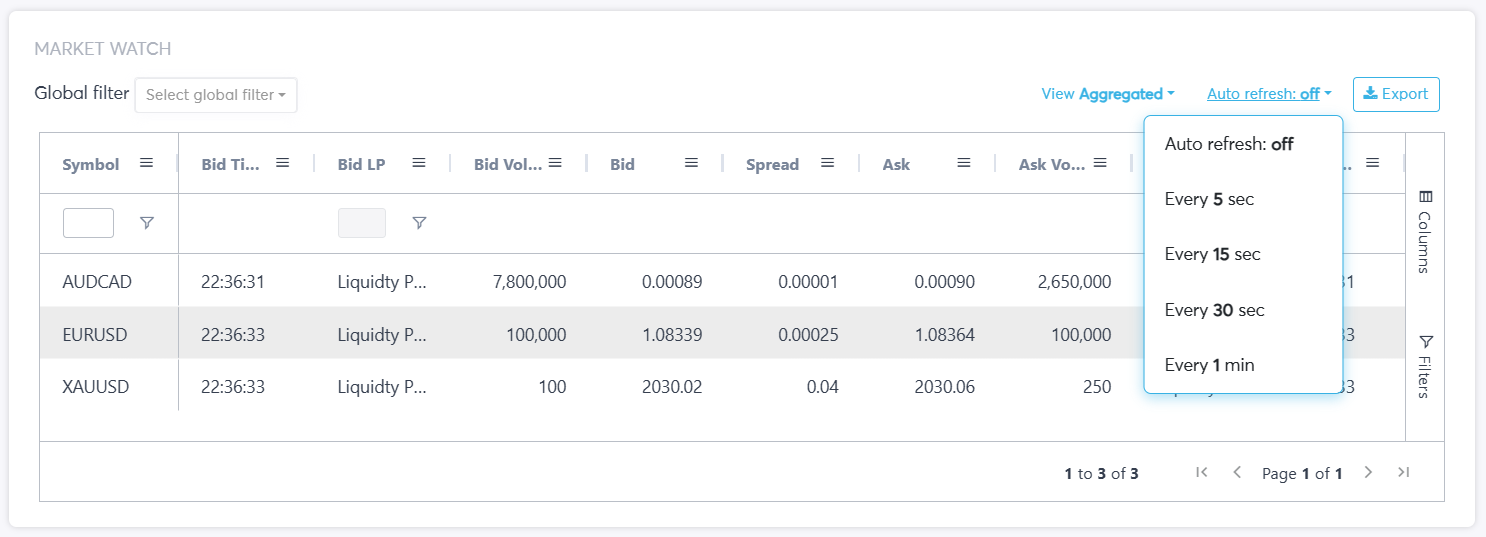
The feature allows the user to set an automatic refresher that checks the symbol parameters every 5,15,30 or 60 seconds. This is configured by selecting the “Auto refresh” icon followed by the chosen time interval icon, to disable this feature the “Auto refresh: off” icon must be selected.
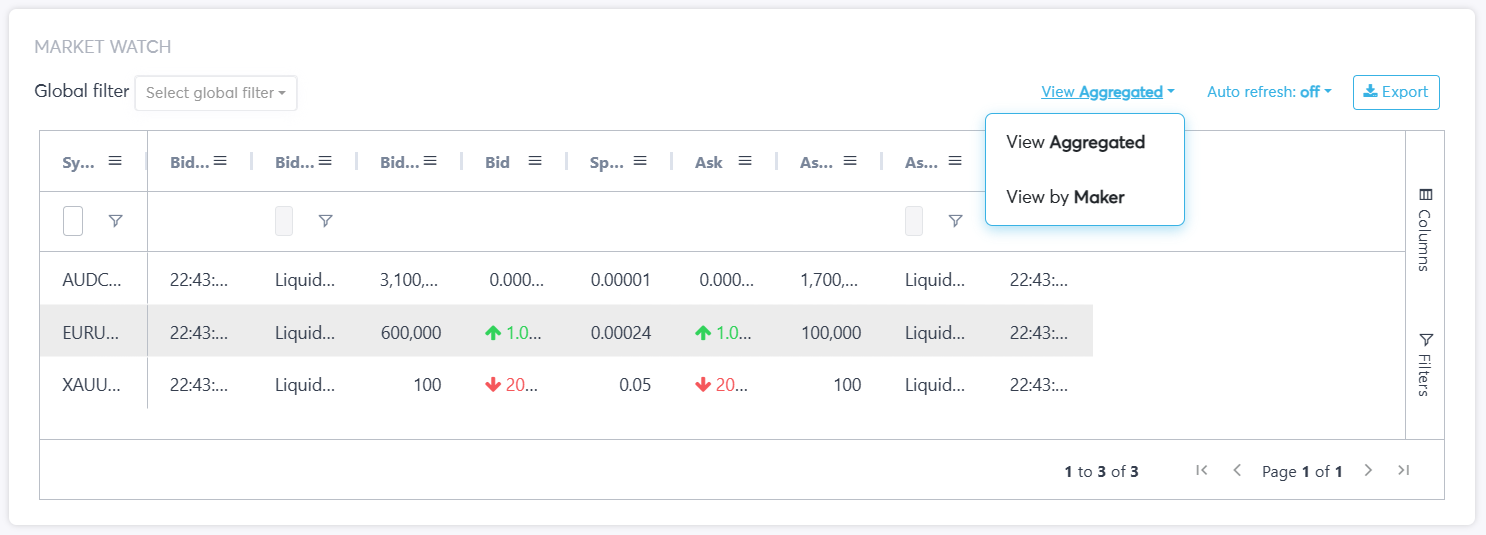
Furthermore the Market Watch allows for both an “Aggregated” and “Maker” view with both being defined as:
-
Aggregated - in this mode the aggregated ask/bid price from several LPs is shown
-
Maker - in this mode only ask/bid price fron one LP is shown
These are enabled by selecting the “View” icon followed by the icon of the chosen mode.
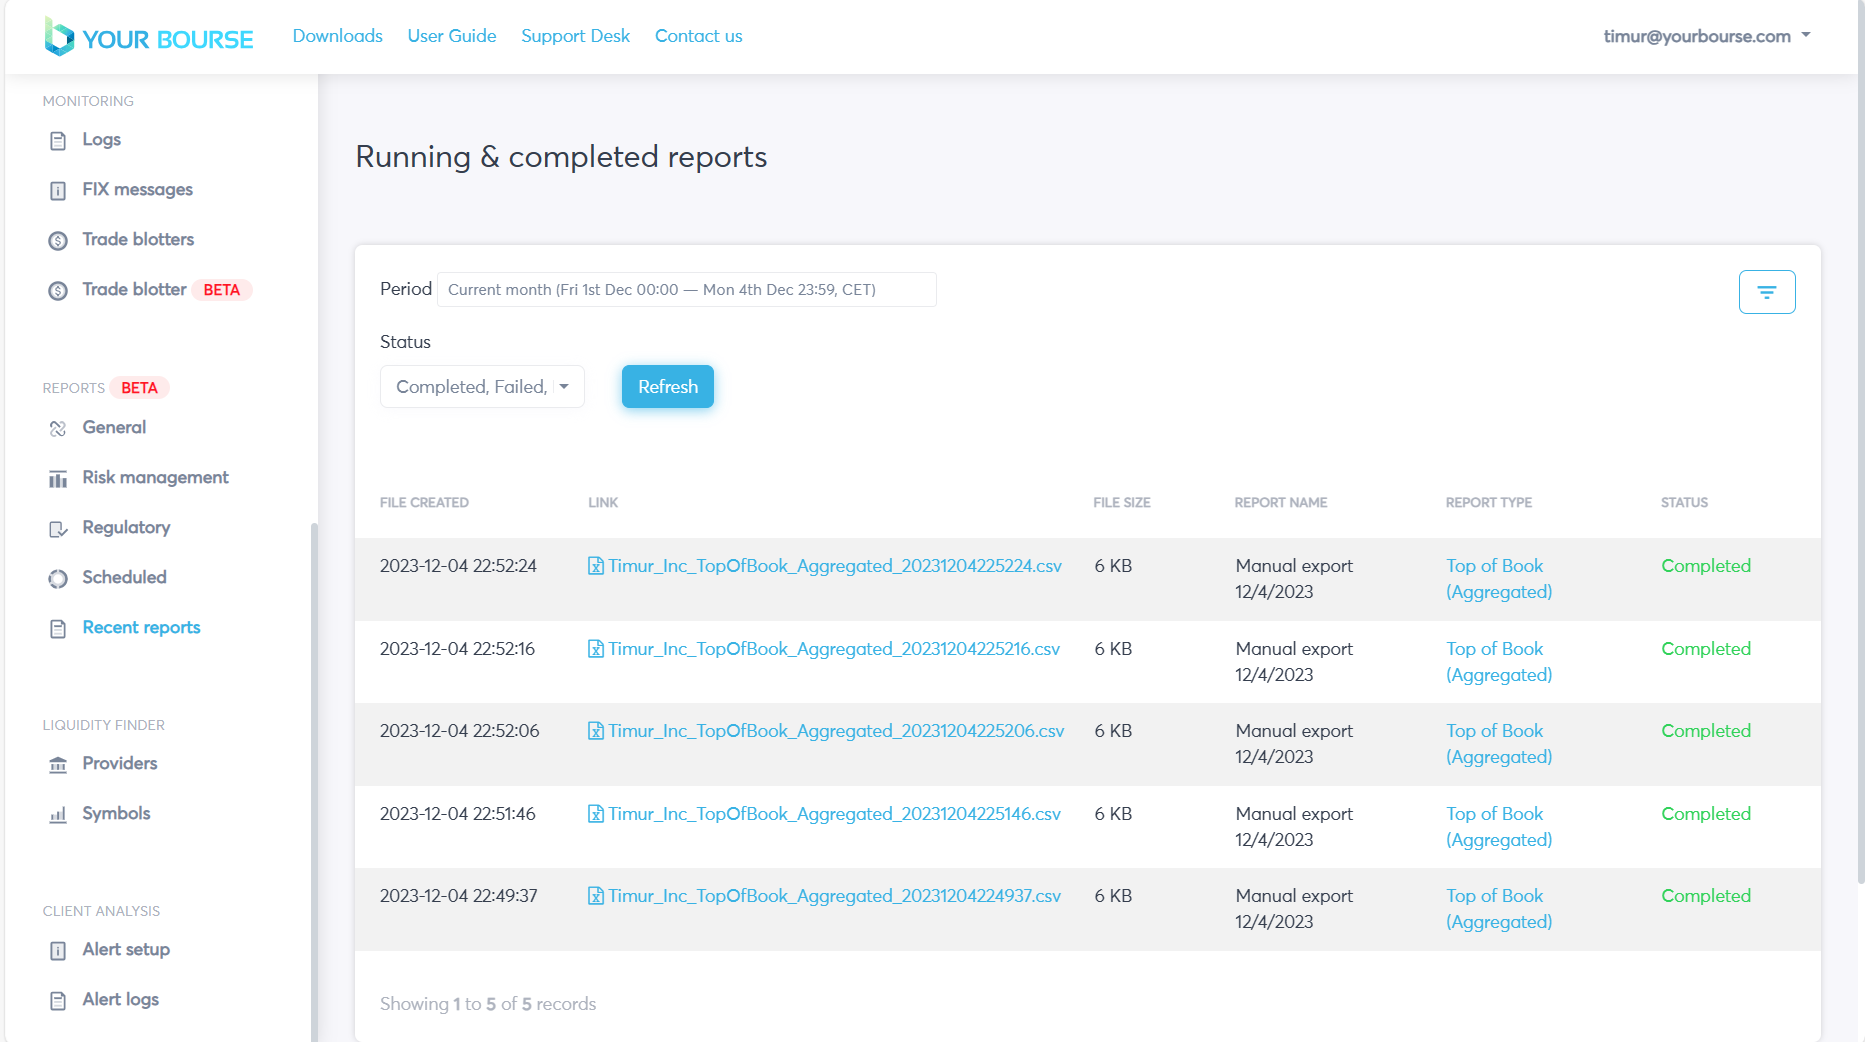
The platform also allows the user to export any necessary symbol data by selecting the “Export” button.
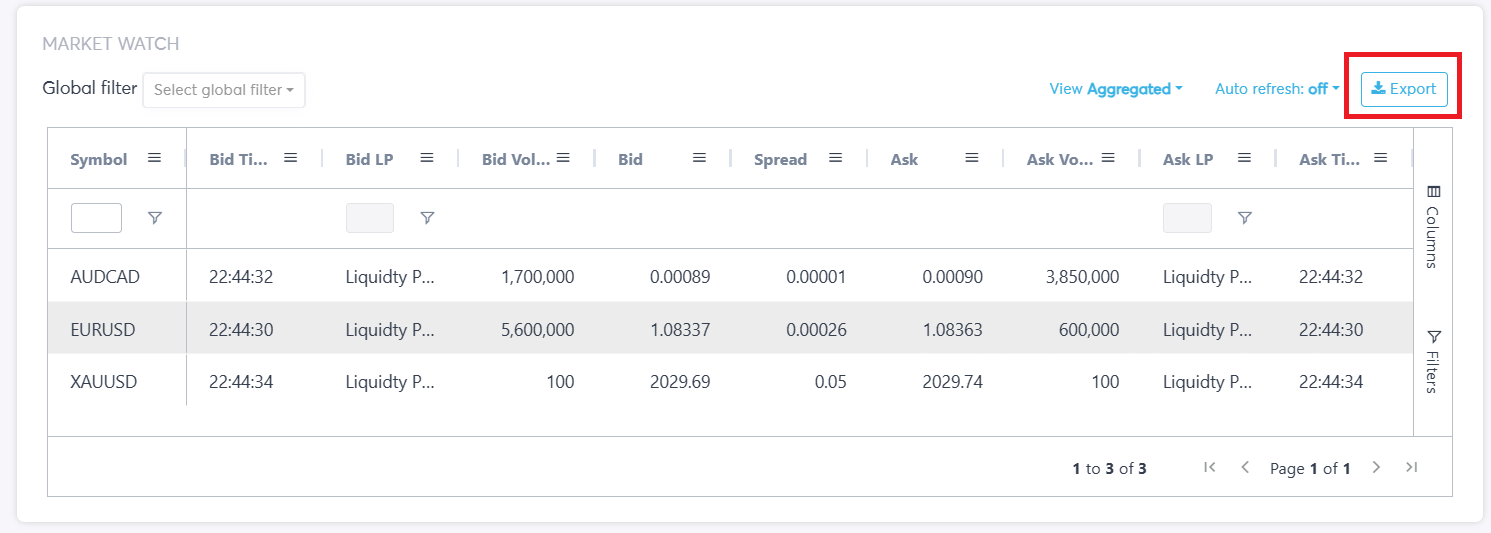
After the “Export” button is selected a processing icon is shown in the middle of the Market Watch table, a green icon stating “Export completed” is displayed and a report is generated. The report is automatically downloaded in an excel format onto the users device. Similarly the report can also be viewed in the “Recent reports” tab.