Log Monitoring
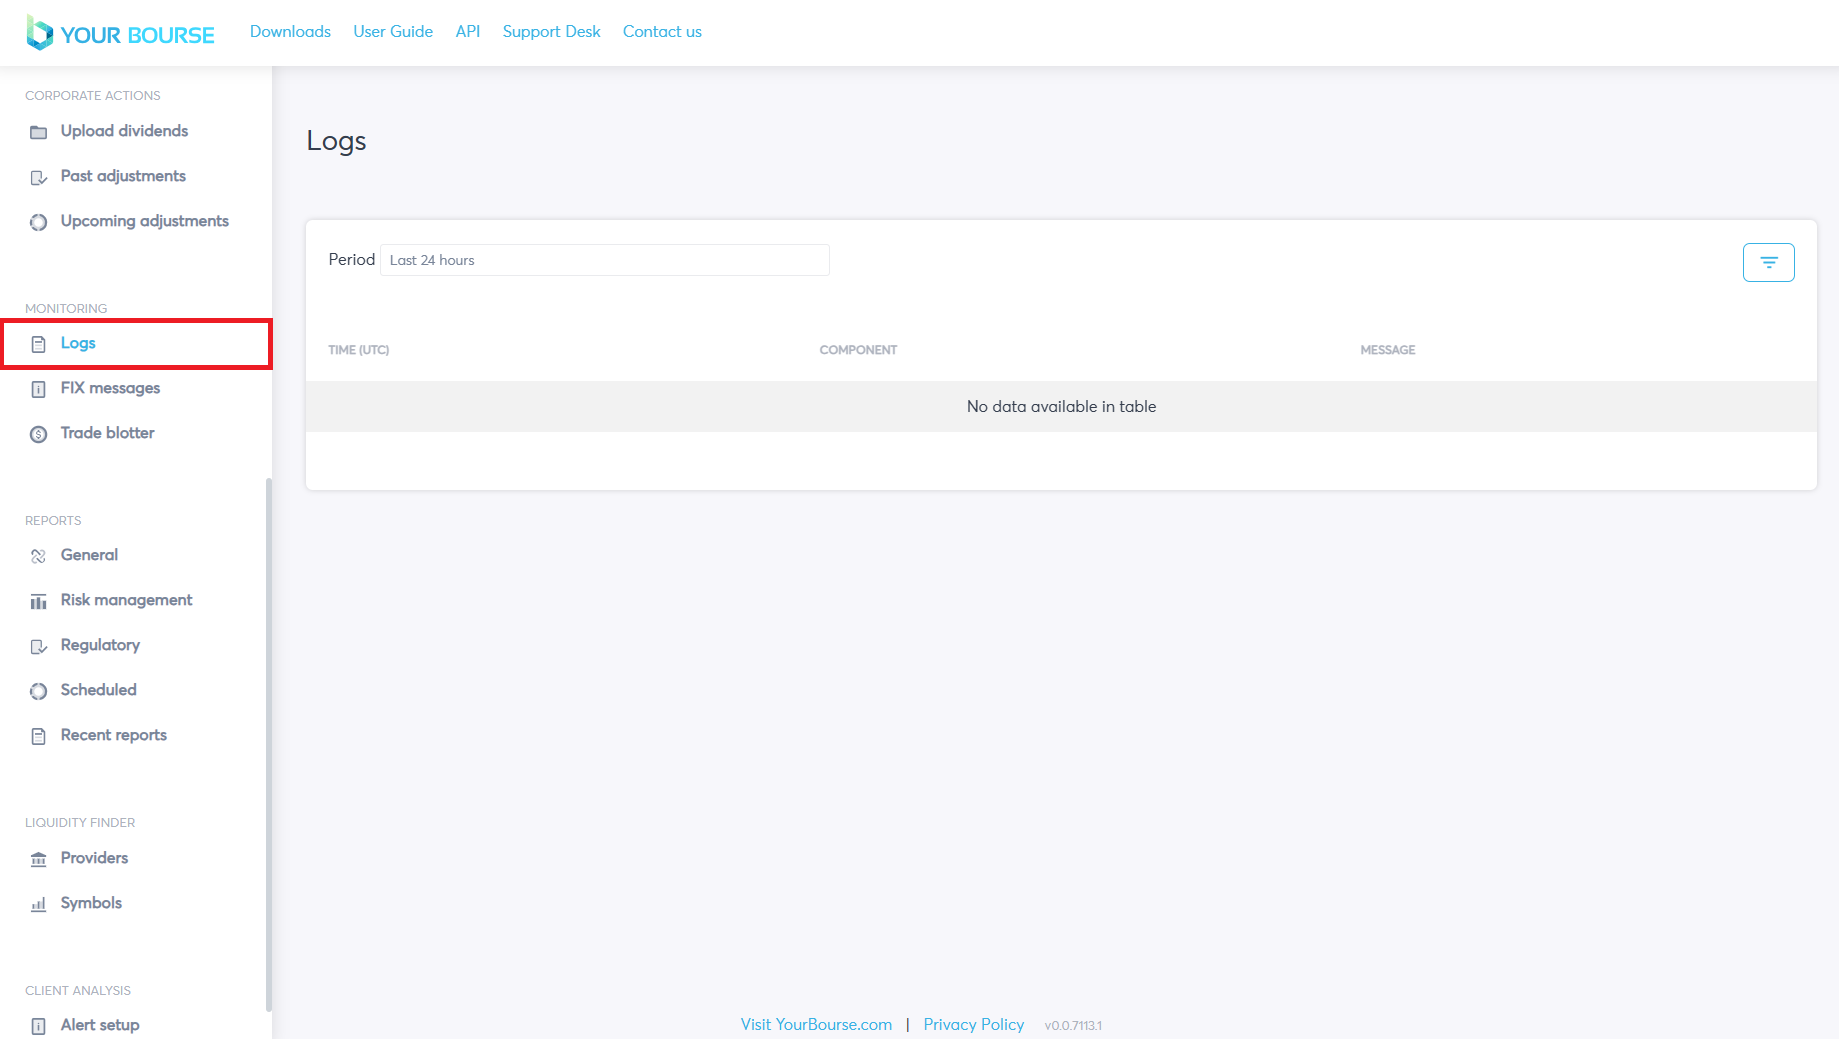
The logs feature allows the user to check and monitor all logs directly through the YourBourse cloud portal. The feature is opened by going to the Monitoring section on the left hand side and selecting Logs.
Main Table
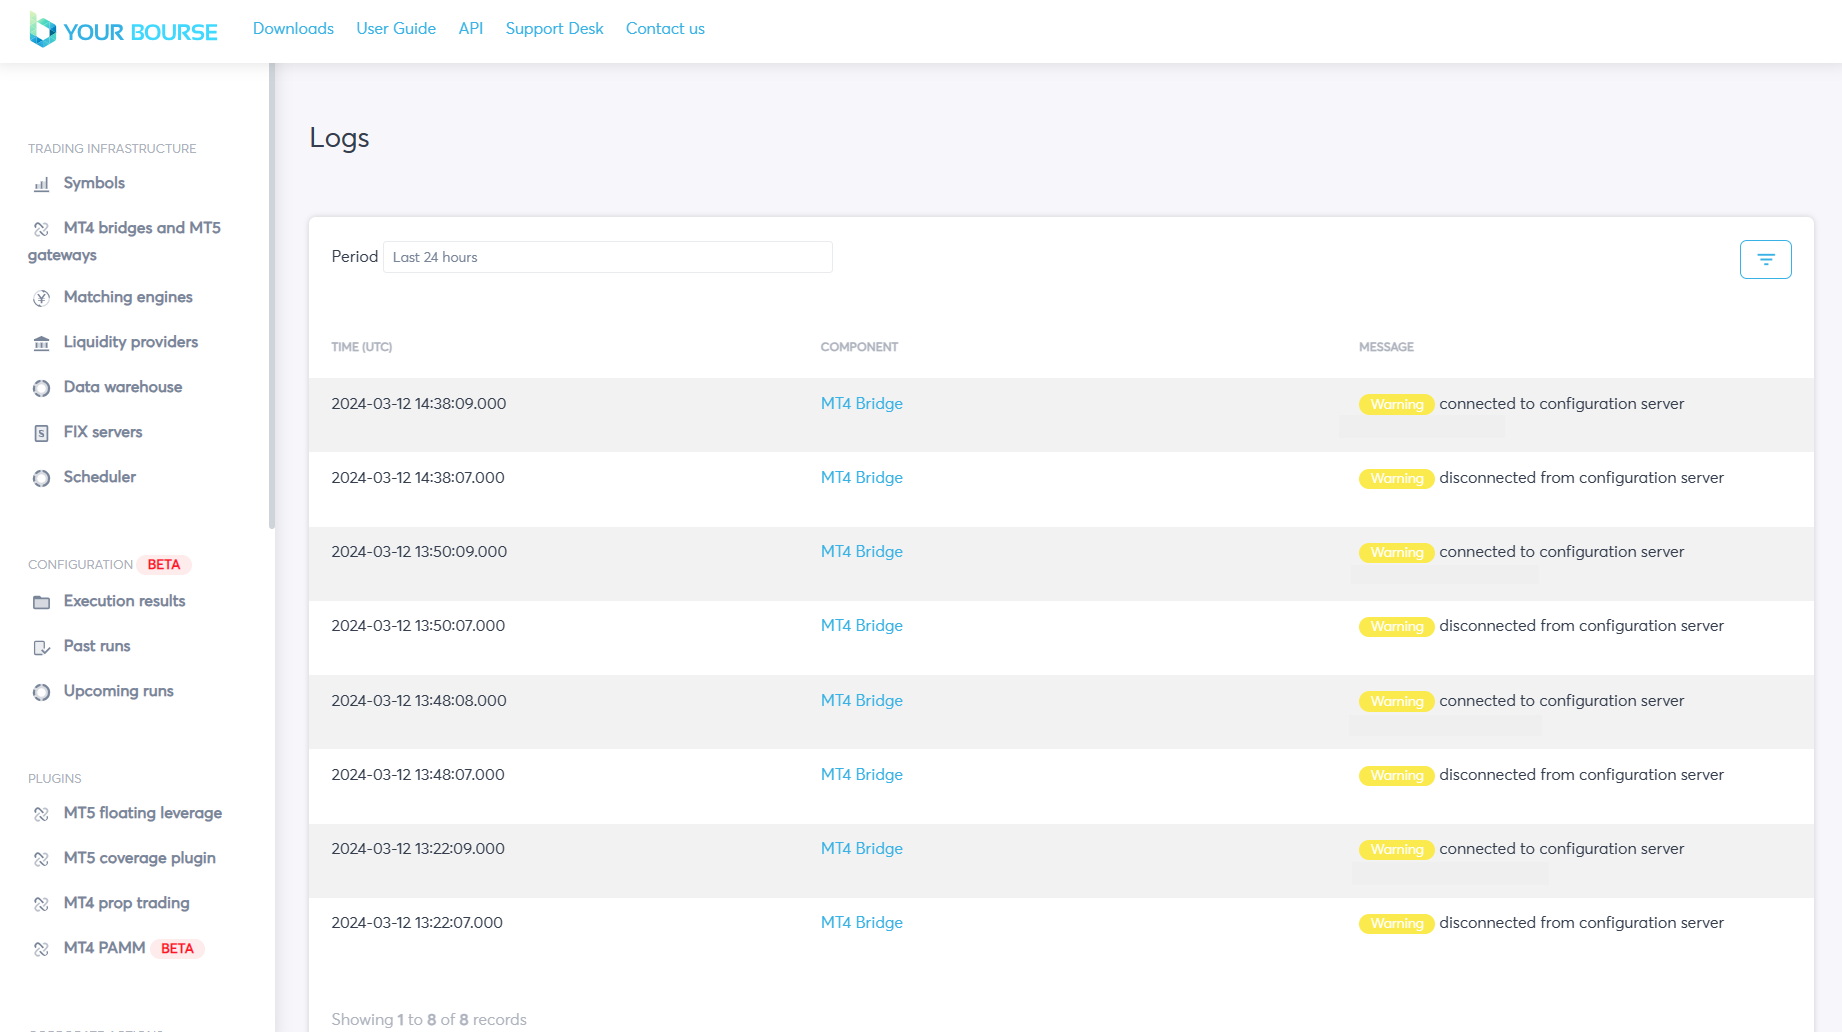
The main table will display logs with three main parameters.
-
Time (UTC) - the time the message / request was sent
-
Component - component associated with the message e.g. Liquidity Provider, MT4 Bridge etc.
-
Message - the actual contents of the message
Multiple logs and messages can be displayed in the table.
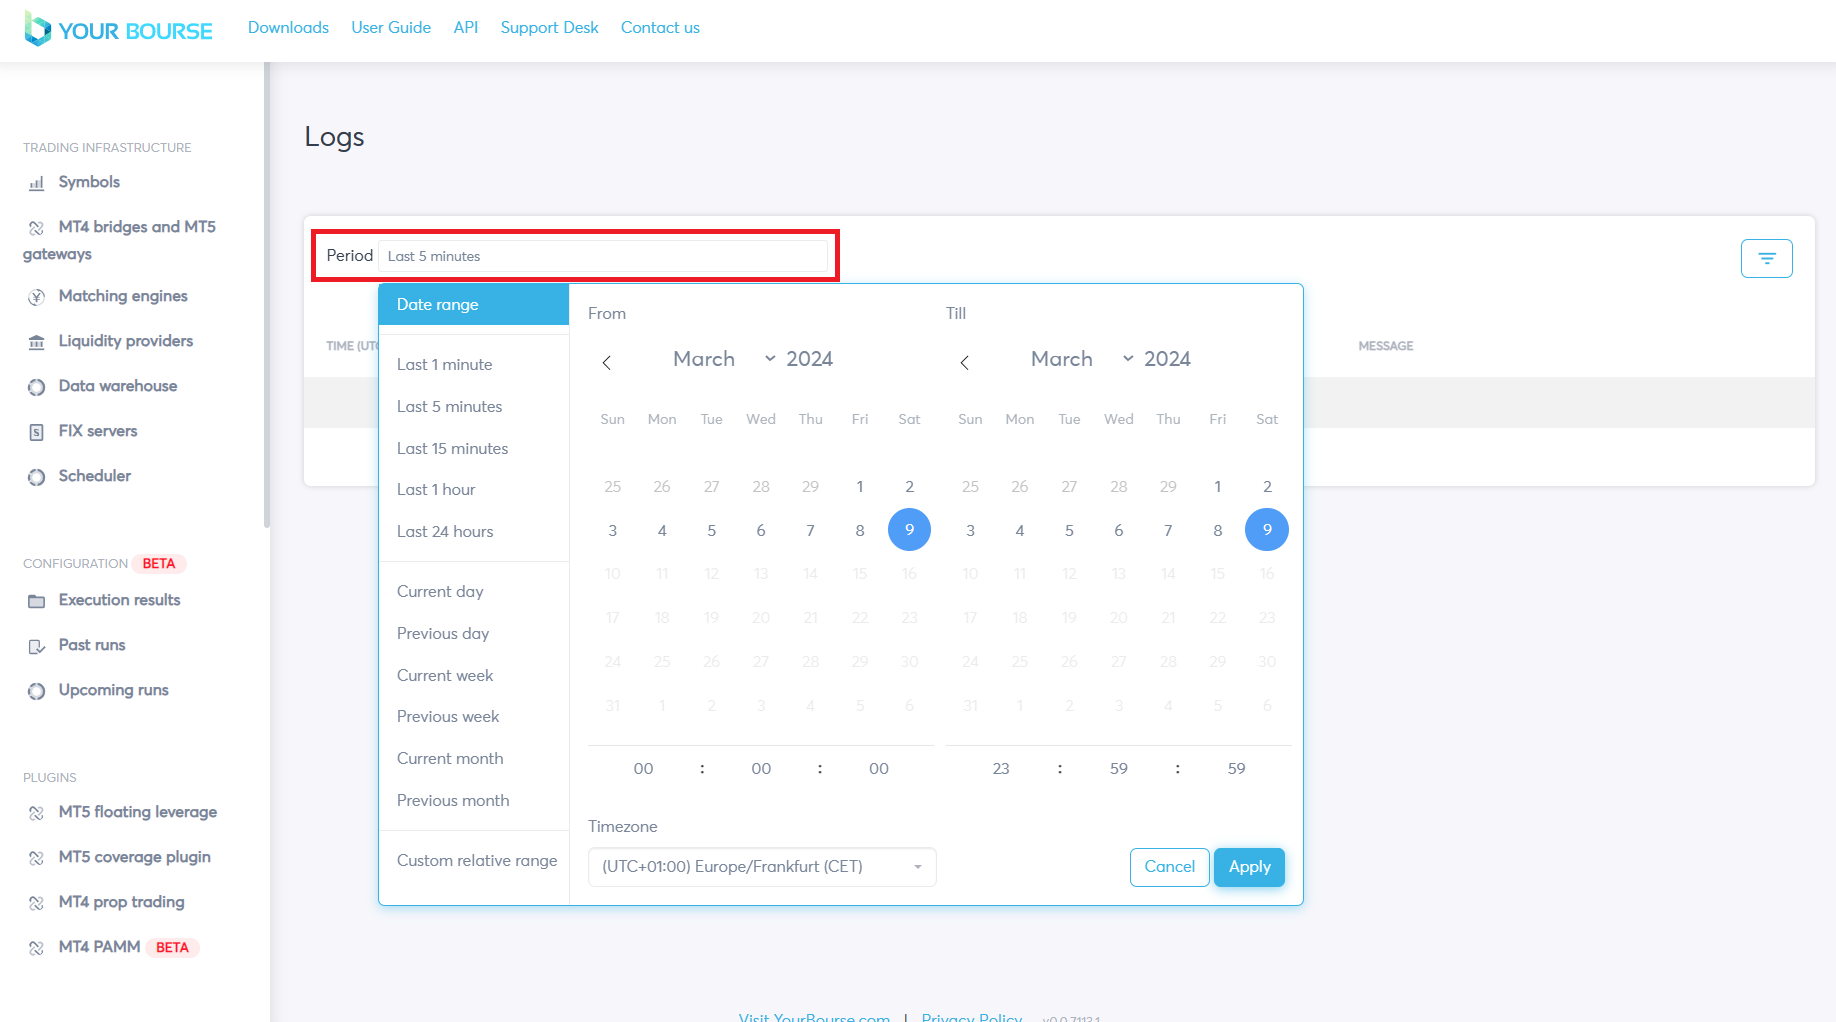
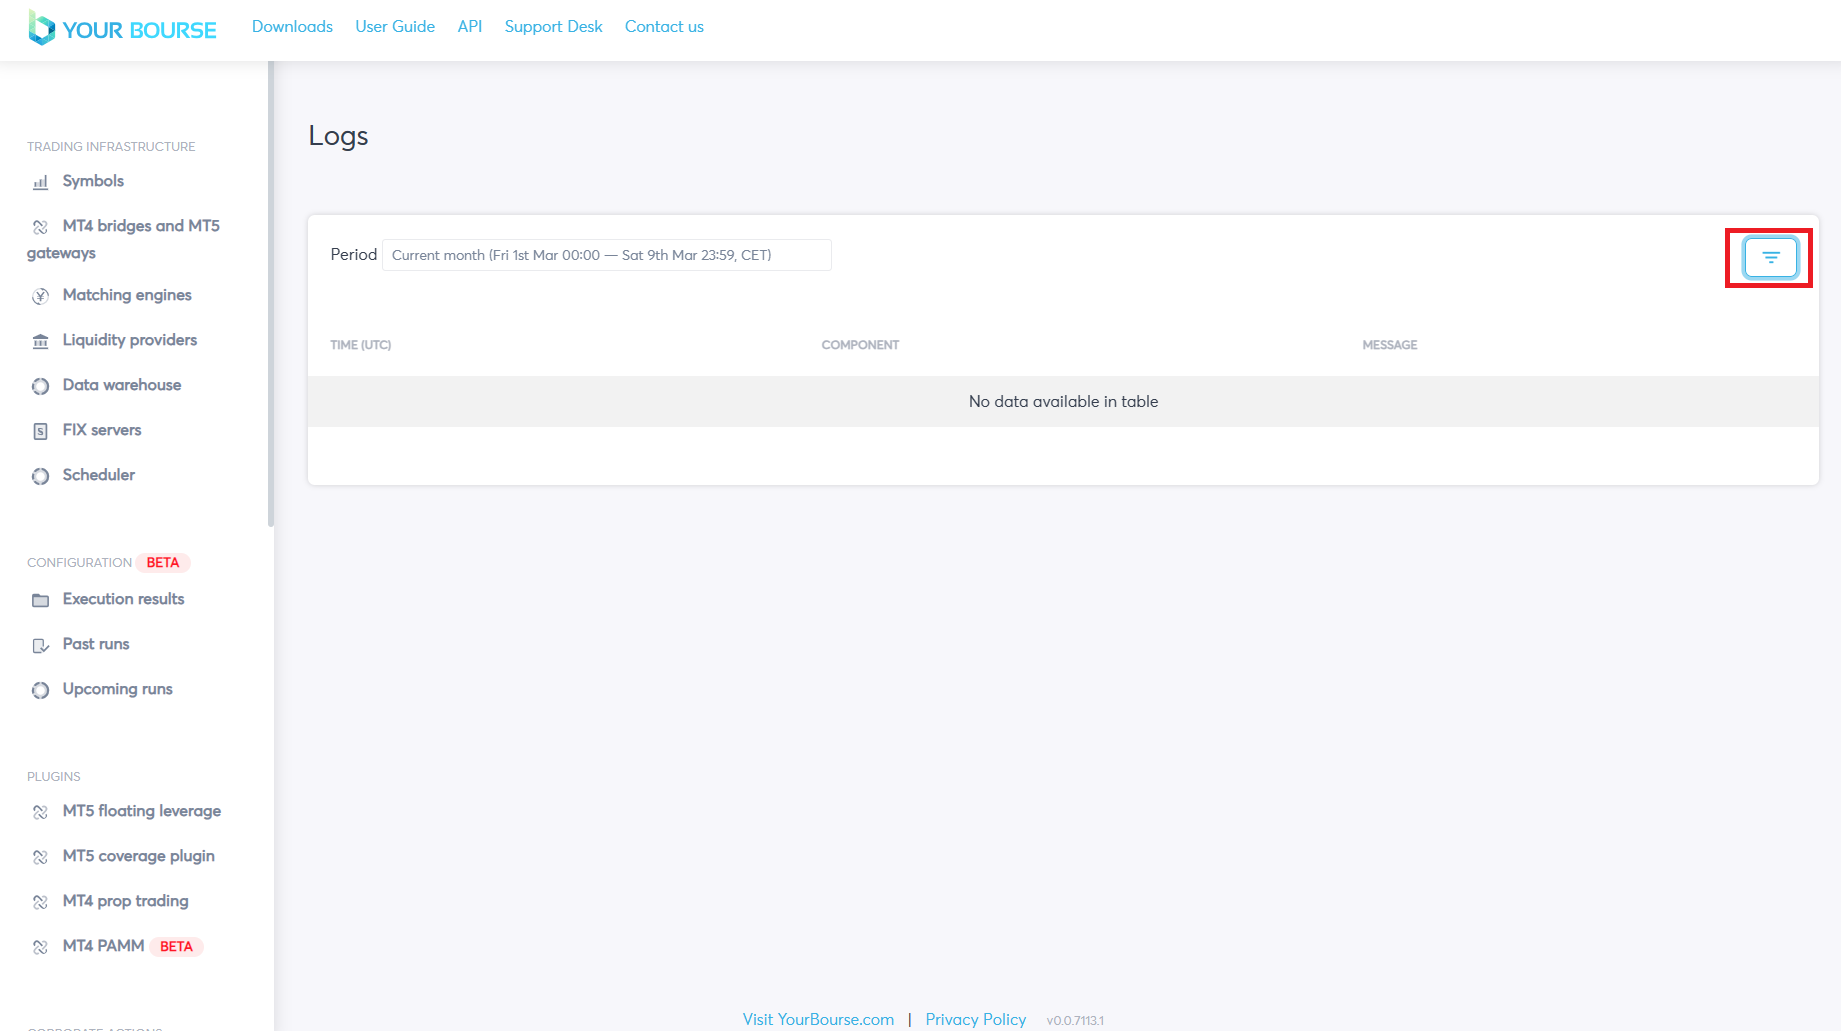
The time period that the logs are displayed for can be adjusted through the Period button, providing many different set and custom time ranges. A detailed description on how to use this period function can be found in the trade blotter user guide.
Filters
The Logs feature allows the modification of which logs are displayed based on specific parameters. To apply a filter the filter button can be pressed, seen by a dashed upside down triangle.
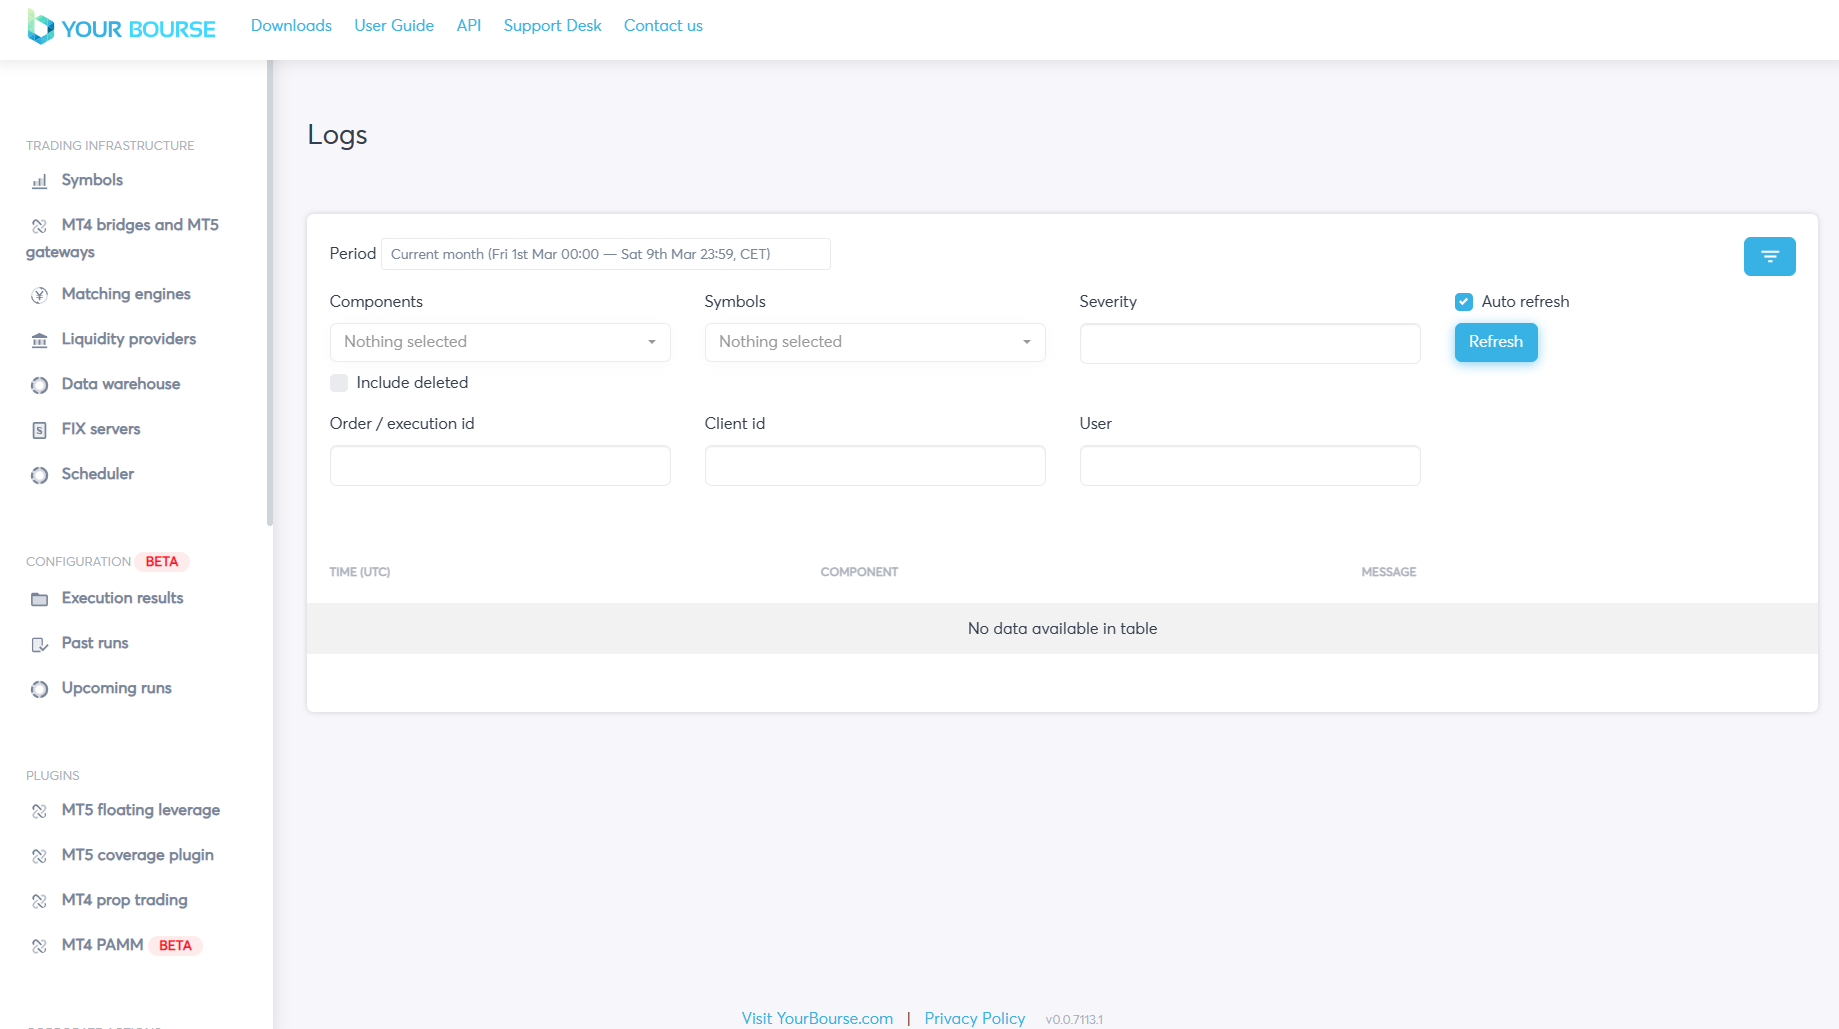
A new filter menu is opened containing six different parameters.
-
Components - the components relating to the message e.g. Liquidity provider, MT4 Bridge etc.
-
Symbols - the specific symbols relating to the logs e.g. EURUSD, AUDCAD…
-
Severity - the type of log e.g. “fatal”, “error”, “warning”, “info” and “audit”.
-
Order/execution id - order or execution Id for trades in MT4 /MT5.
-
Client id - MT4/MT5 account Id.
-
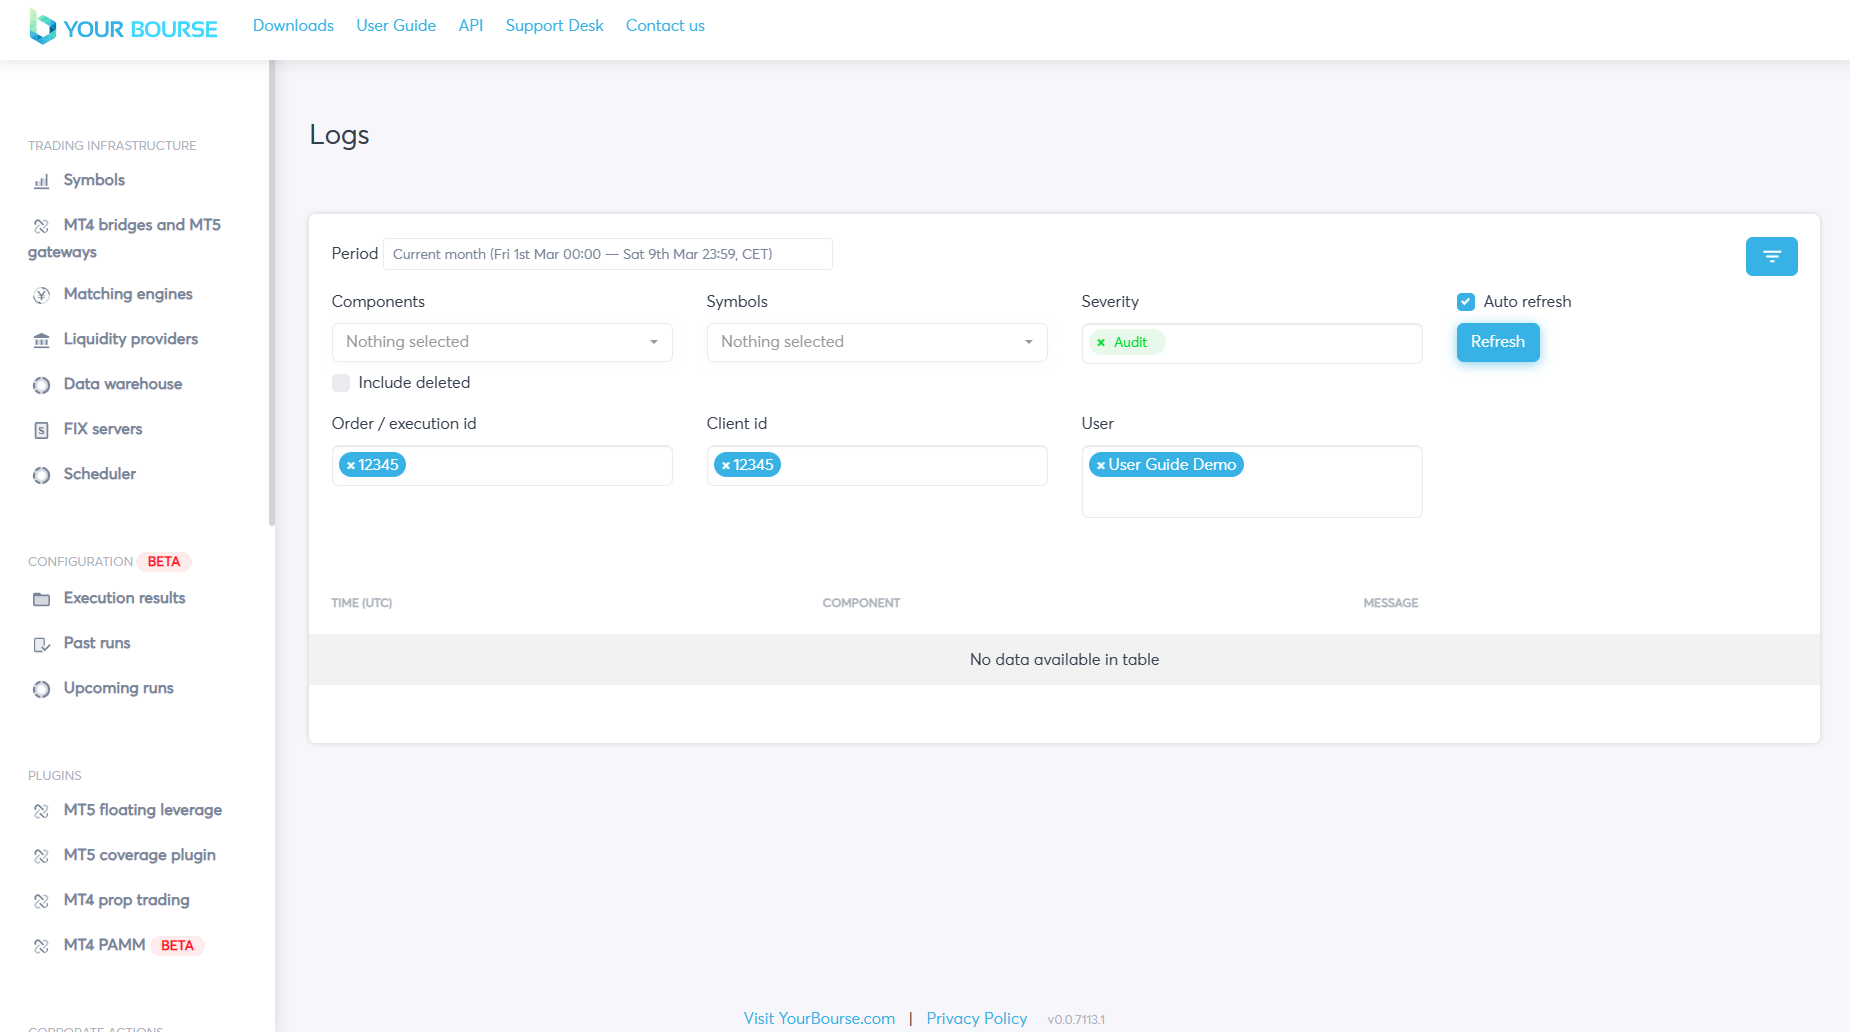
User - the specific user the logs relate to, users are configured using the User management feature.
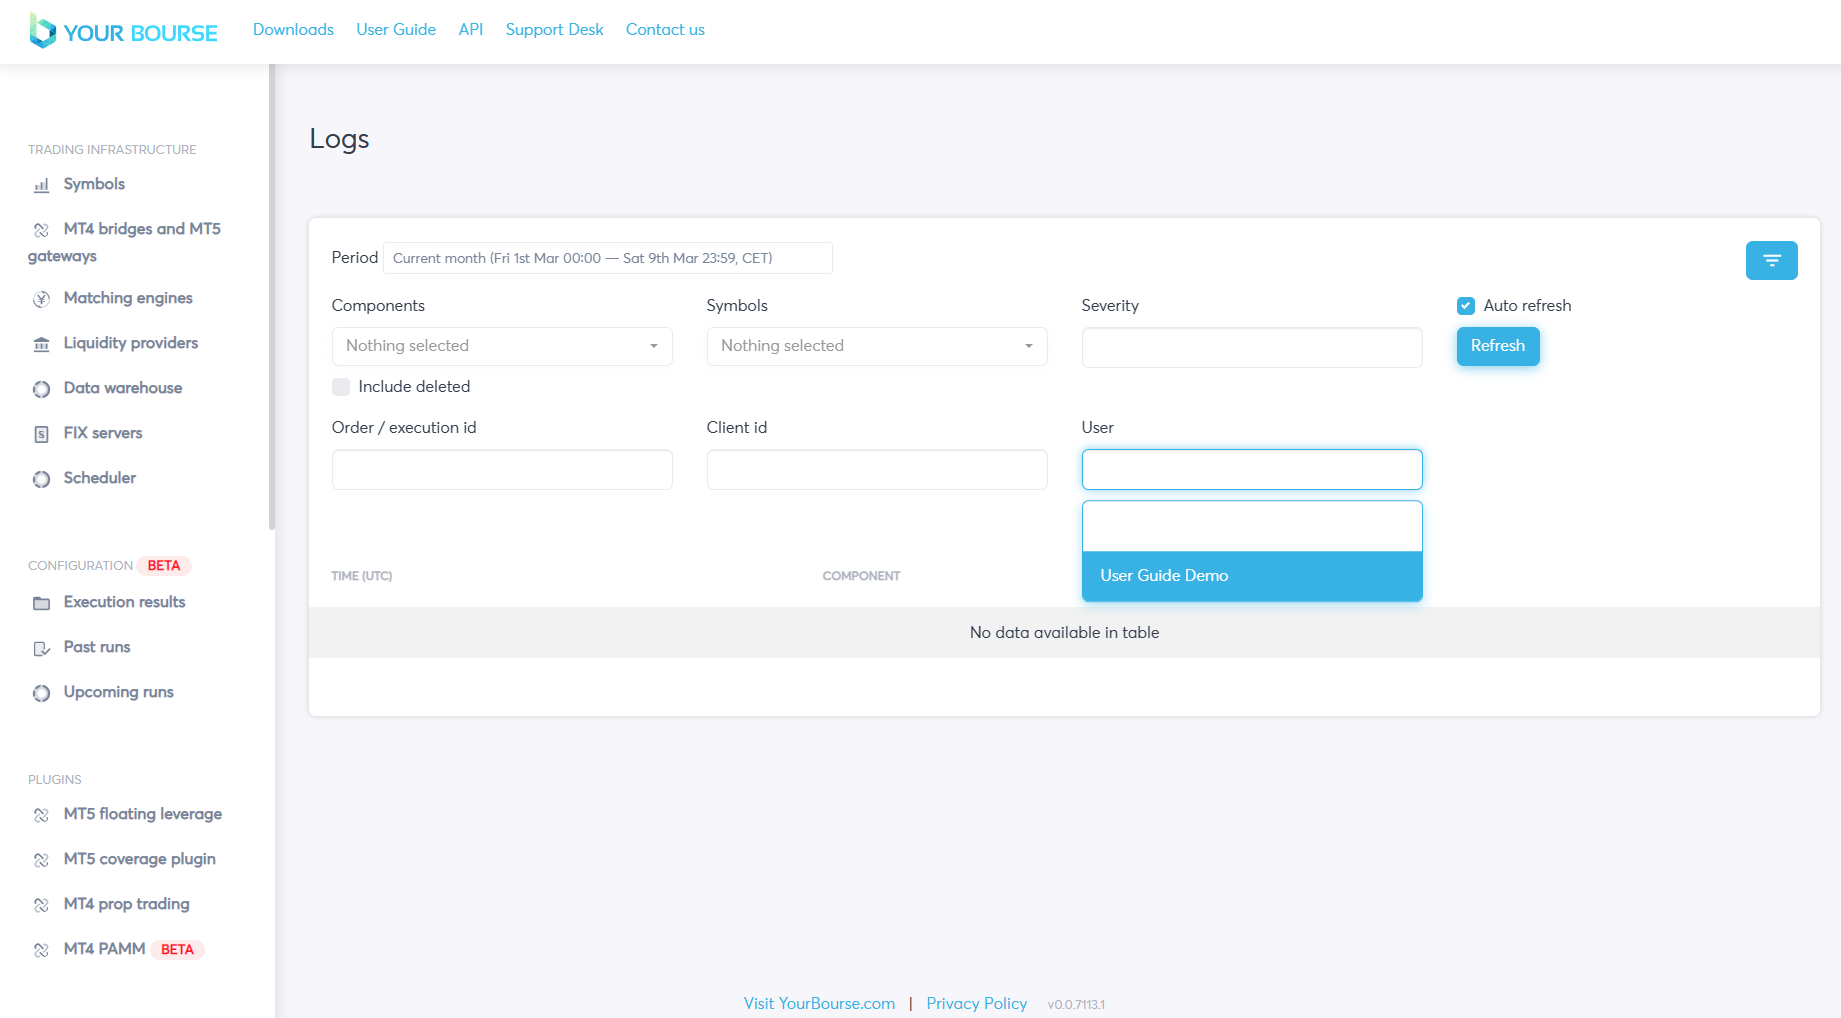
Each parameter is configured in the same way, firstly by clicking on its corresponding box then specifying each parameters value. Lets start with the User parameter as an example. Selecting the User box will open a drop down menu containing a list of users that have been configured using the User management feature.
The User management user guide can be found here.
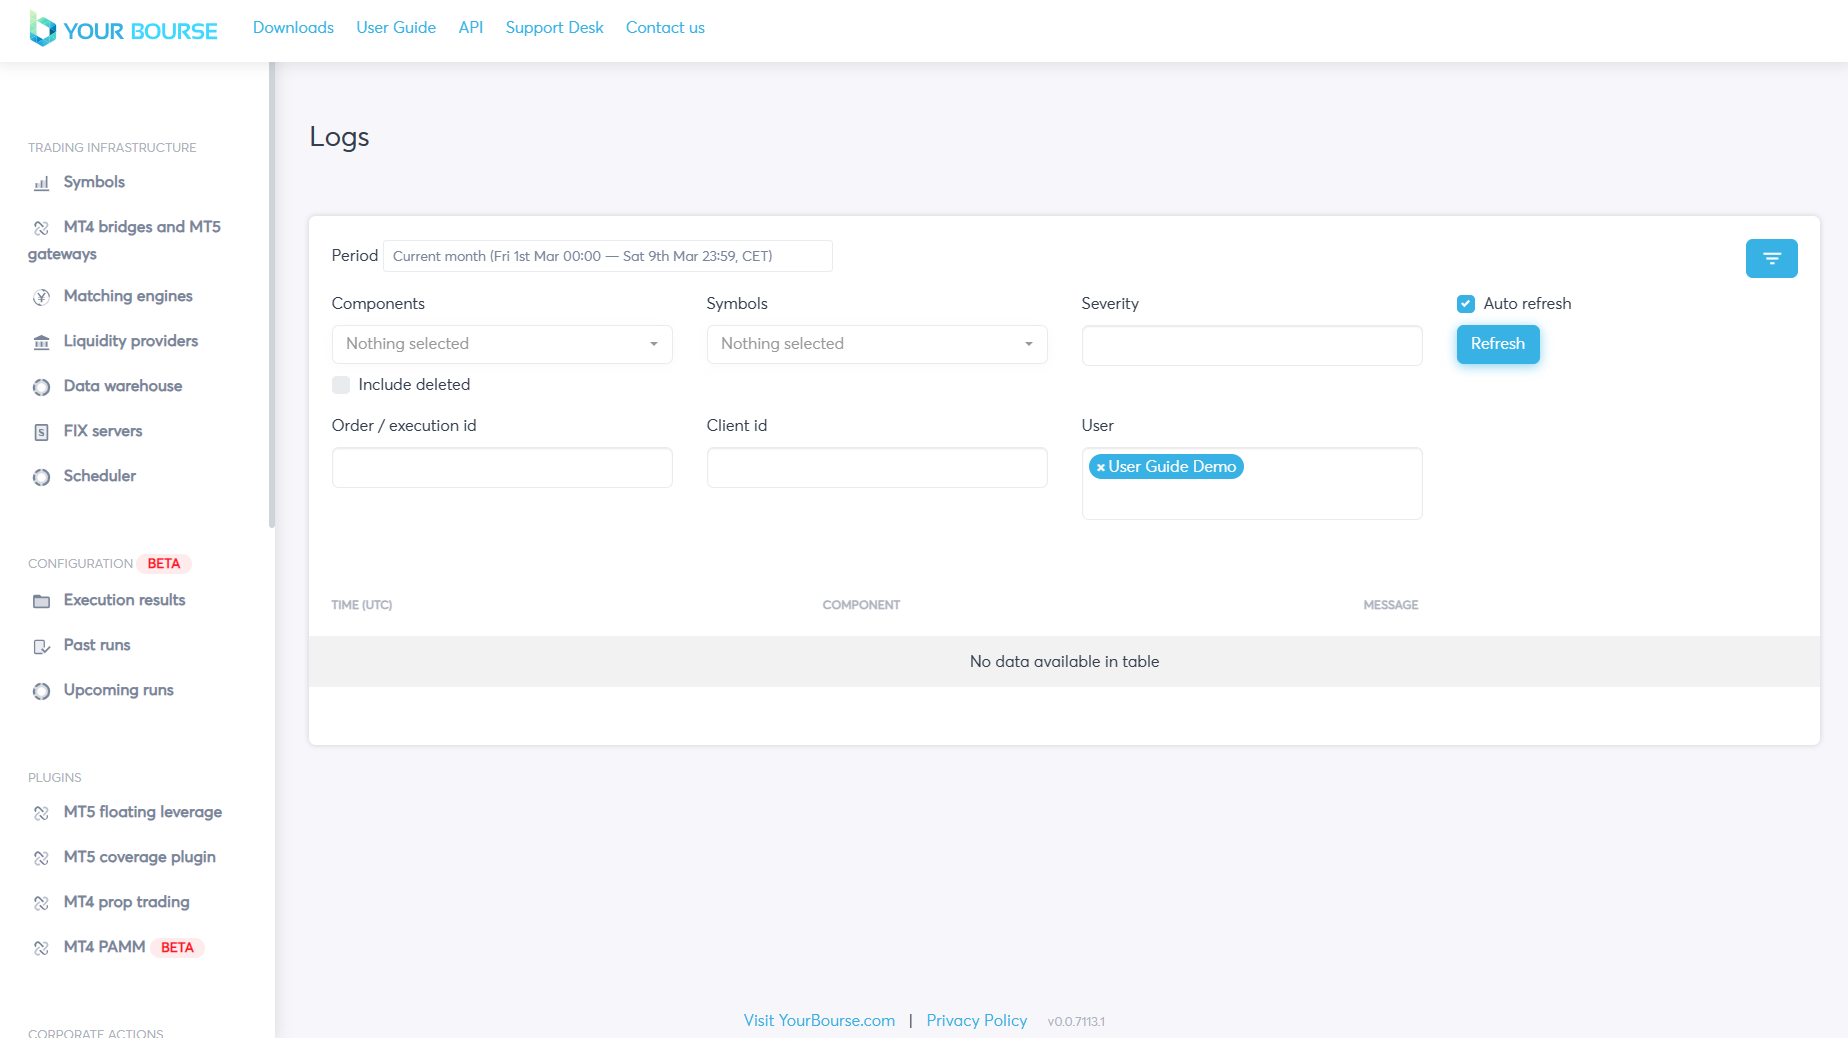
The desired user can be selected and should now be seen in the box. To remove a user the cross can be clicked.
The Severity parameter is configured in a similar way with a menu of five different options.
-
Fatal - displays logs that are seen as “Fatal” or severe. For instance, “Invalid configuration“ messages can be found here.
-
Error - displays any error logs e.g. decimal place mismatches for symbol configuration, invalid values for custom parameters, etc.
-
Warning - displays any warning logs. Mostly one can find here logs about connection and disconnection from Your Bourse components.
-
Info - displays logs relating to trades in Meta trader 4 and 5
-
Audit - displays all changes made on the platform. For instance, logs about launching Trade Blotter, or configuration of the Scheduler can be found here.
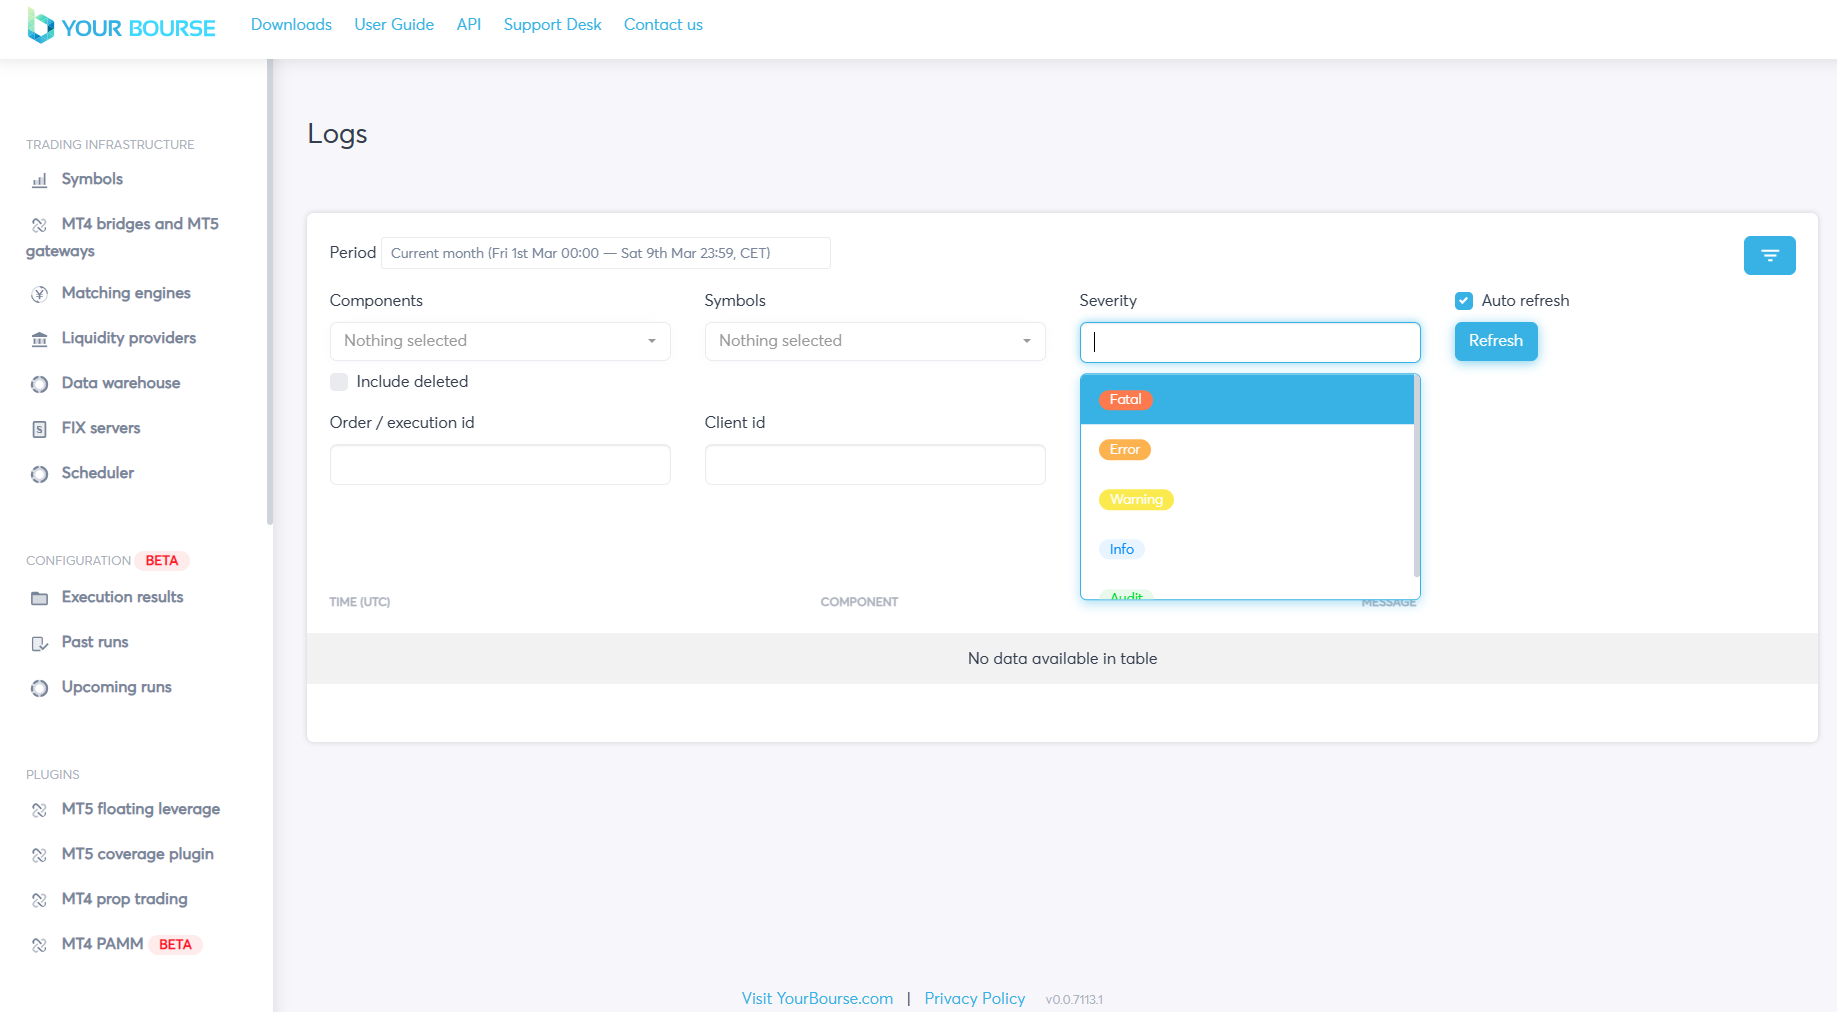
The desired severity can be selected and should now be seen in the box. Multiple severities can be chosen by clicking the box again.
The Client id and Order / execution id can be configured by clicking the corresponding box and typing in the desired id’s.
The Symbols and Components parameters are configured by first selecting their corresponding box. Taking the Symbols parameter as an example a drop down menu is opened.
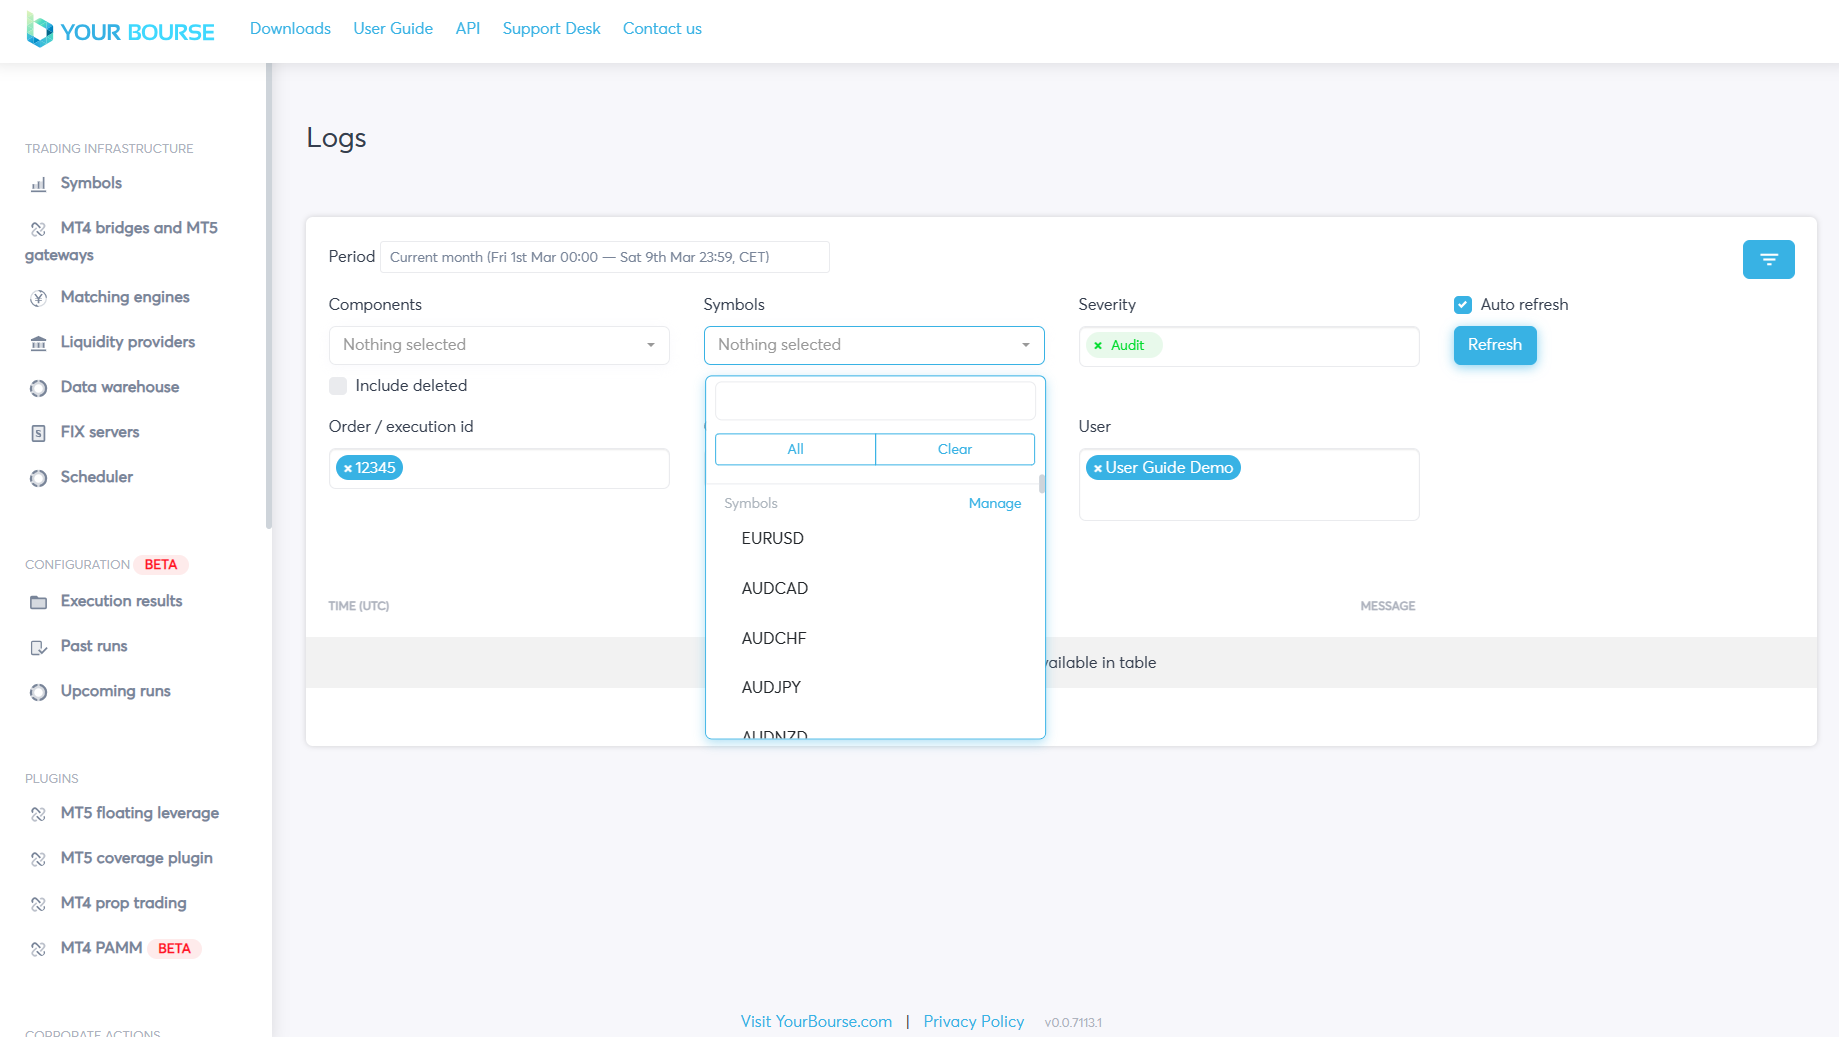
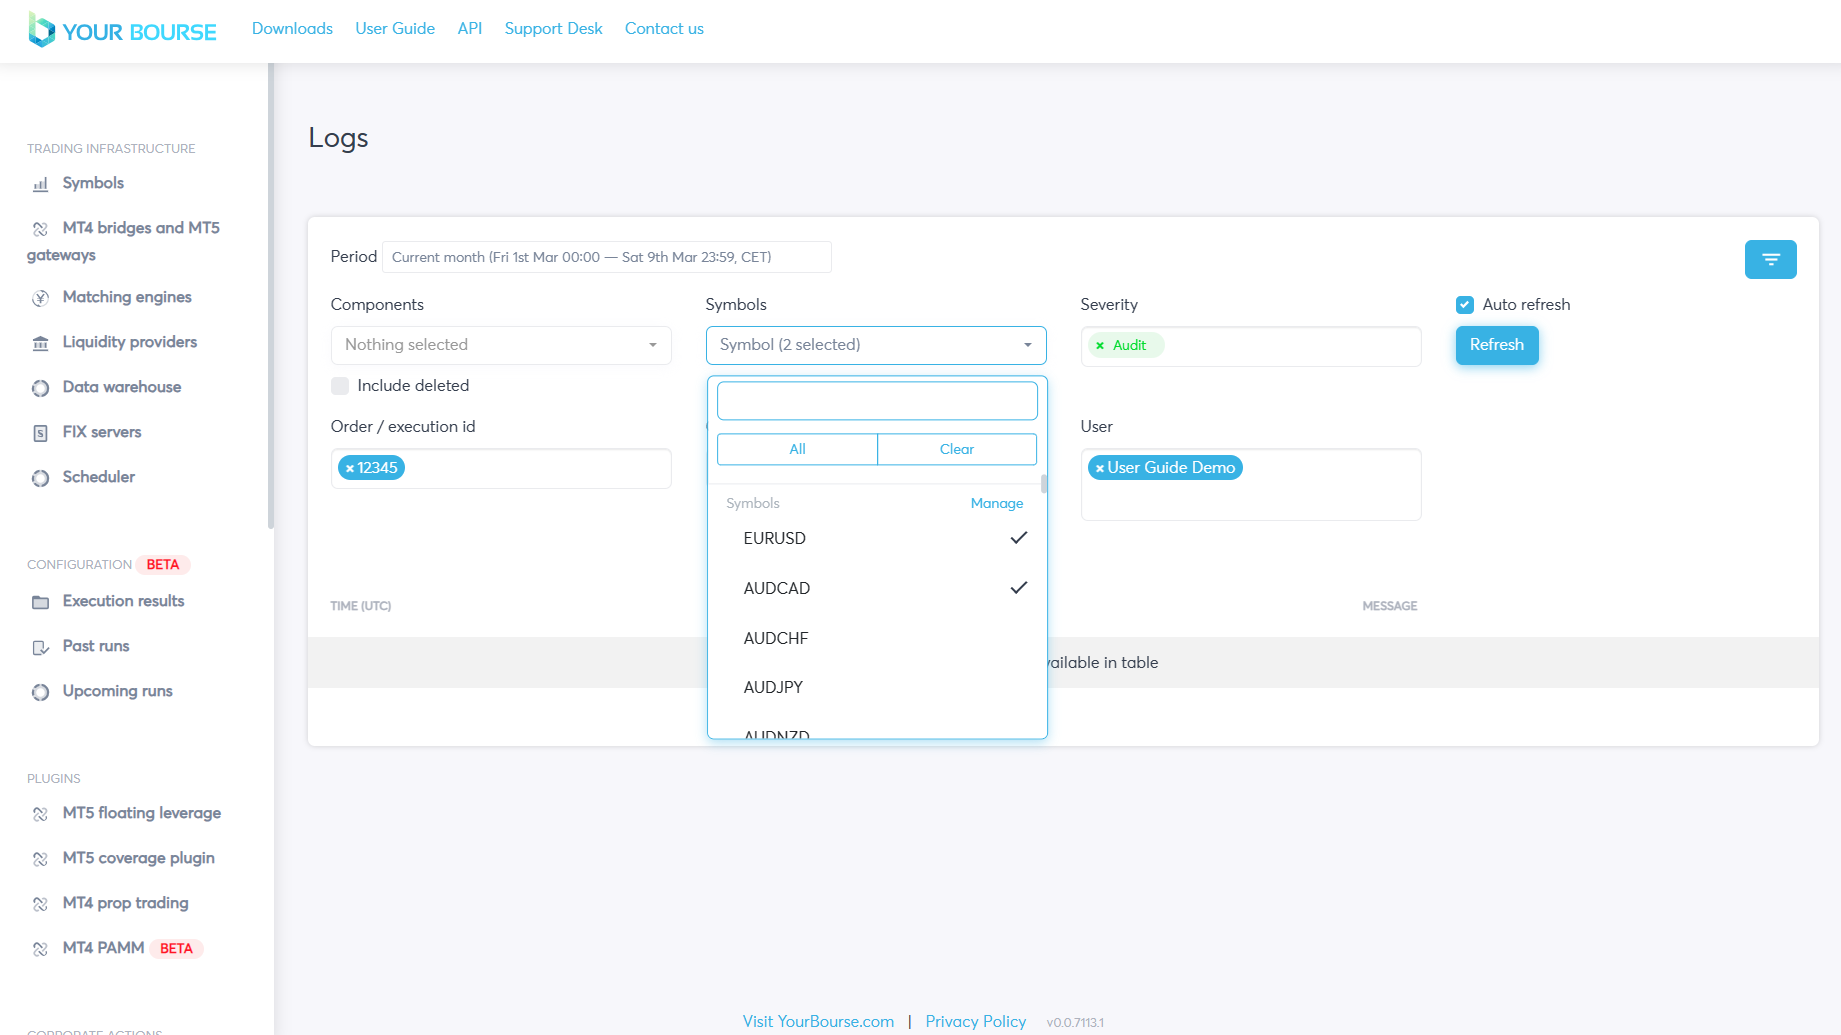
To select a specific symbol the user can search for it and then click it. Multiple symbols can be selected.
Note a tick should be seen next to the symbol indicating it has been selected, to deselect a specific symbol the user must click it again removing the tick.
The All and Clear buttons can also be used to help select symbols. The All button will select all the symbols configured and the Clear button will remove all the selected symbols.
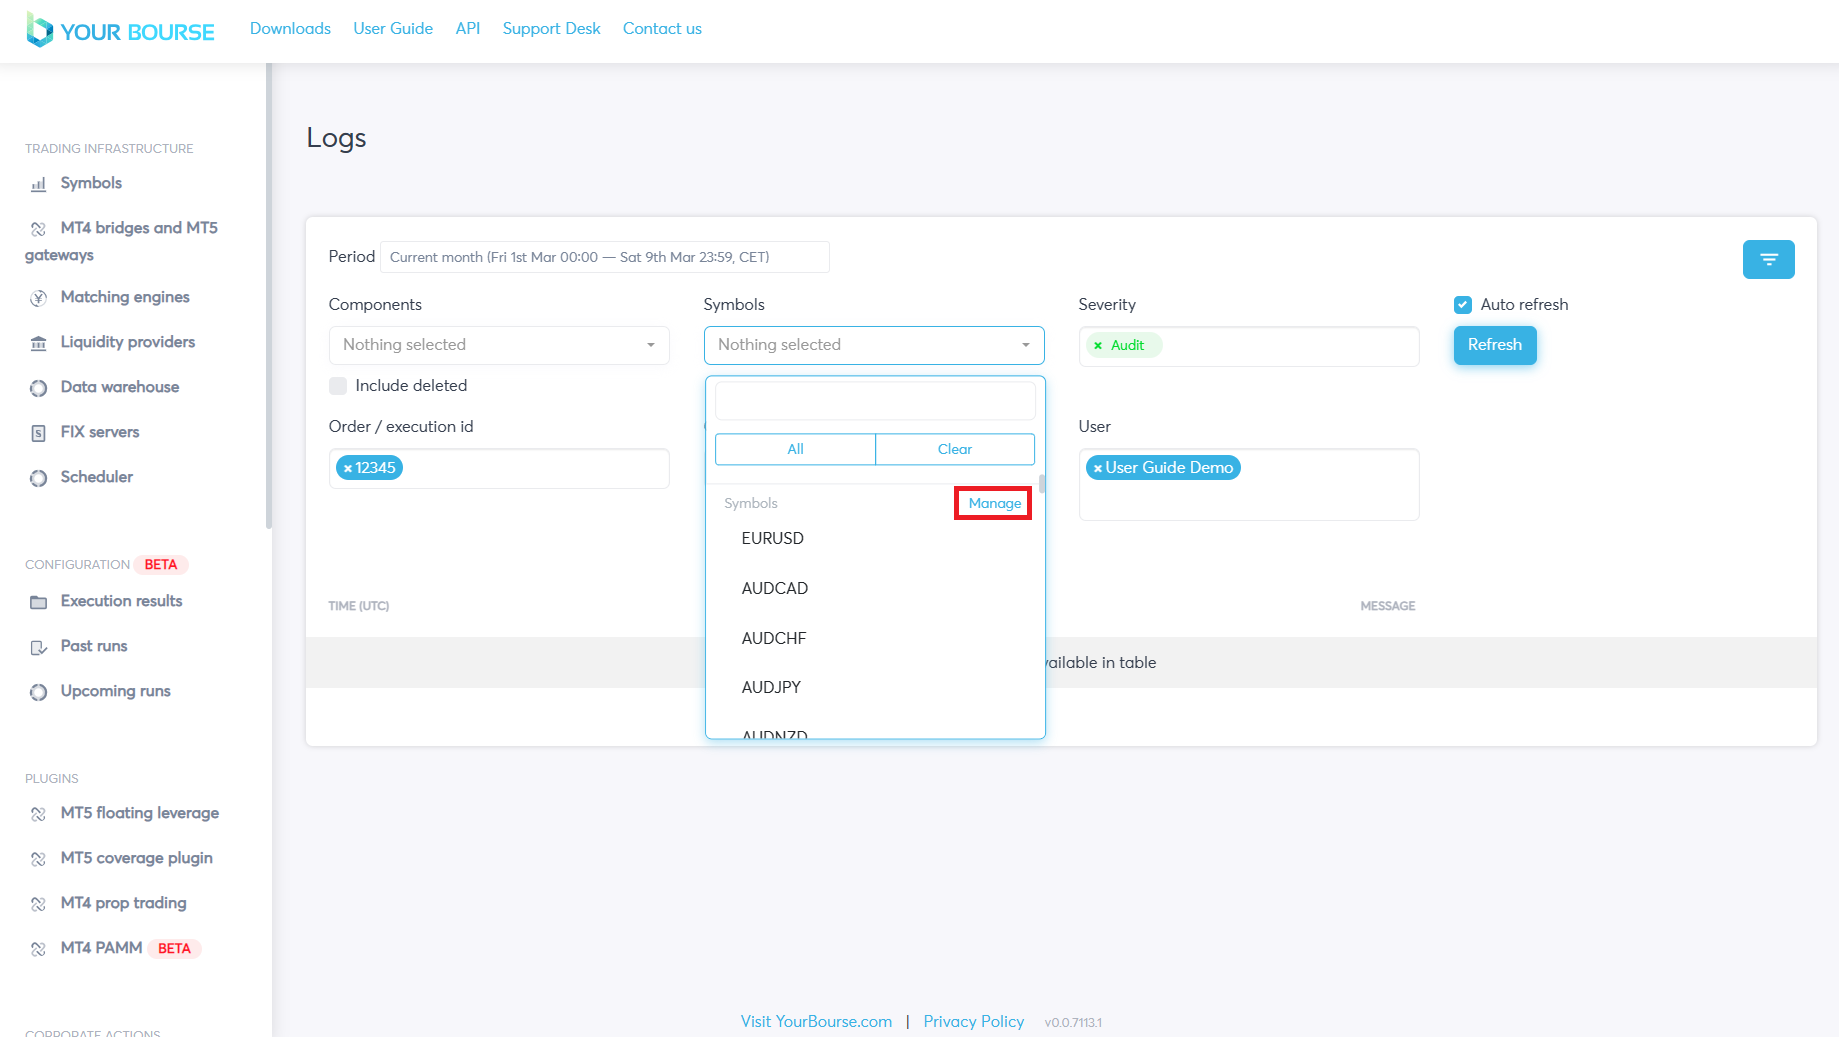
By clicking the Manage button the Symbol profile page is opened, the Symbol profile feature works to create groups for specific symbols with multiple different parameters and its corresponding user guide can be found here.

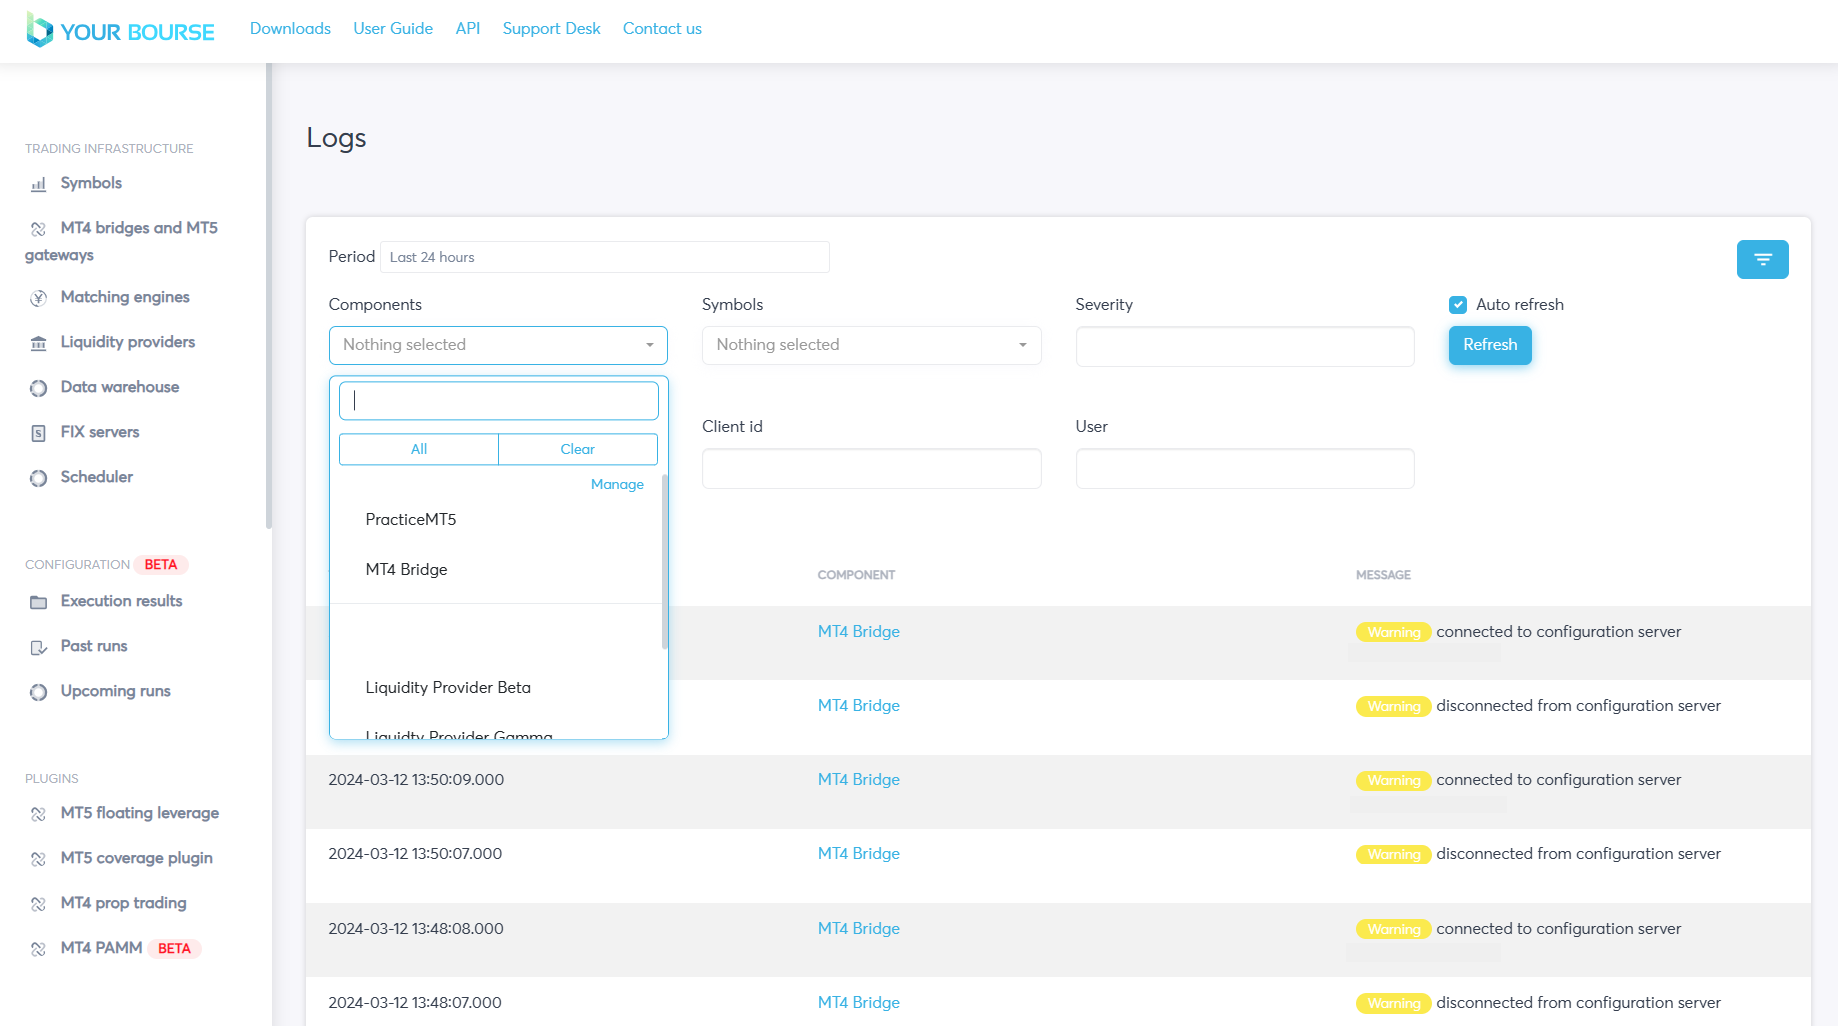
The Components parameter is configured in an identical way to the Symbols parameter.
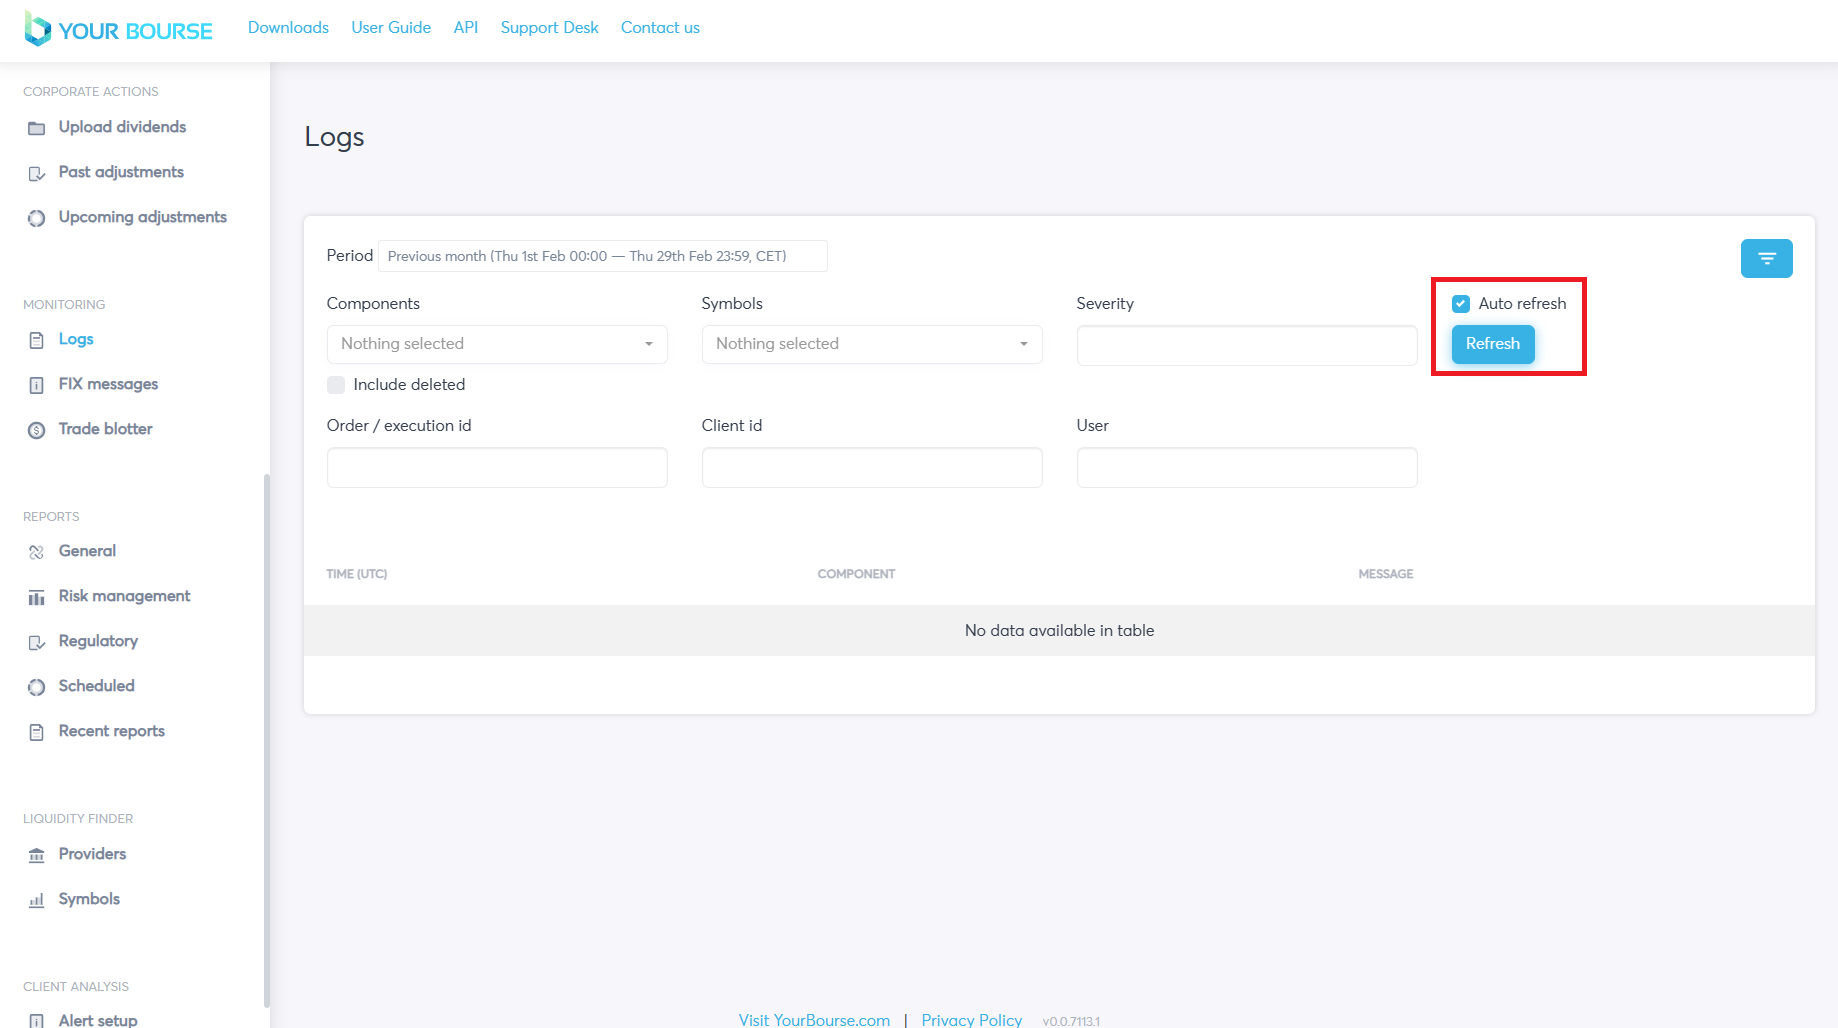
There are two ways to update the logs displayed in the main table. The first involved manually clicking the Refresh button, this will display all the logs up to this point. The second is by selecting the Auto refresh box, this will automatically update and display any logs.
Note if a blue box with a white tick is seen this indicates the box is selected, if a grey box is seen this indicates it is de-selected.